PriceCatch Forex Crypto Screener FHi,
TradingView community and Forex & Crypto traders. Warm Greetings.
PriceCatch Forex Crypto Screener Free Version.
I am sharing a script that screens Forex pairs, XAGUSD, XAUUSD, BTCUSD and ETHUSD for Probable Breakout signals. This script may prove to be useful to traders who trade in the above instruments.
Once this script is added to your chart and the resolution is set, it will automatically keep watching for any breakout on the above instruments and display the results on chart for your attention.
I have already shared the script "PriceCatch-Signals Buy Signals" that marks the following levels on the chart.
Probable Breakout Buy Level
Stop-Reverse Buy Level
While the script "PriceCatch-Signals Buy Signals" can be used independently on all instruments like stocks, Forex, Crypto, commodities etc., this script is intended to be used with the script "PriceCatch-Signals Buy Signals".
Used together, these two scripts may help you identify probable breakout opportunities. This Screener will help you screen the above instruments that have broken out of any of the Breakout levels marked by the "PriceCatch-Signals Buy Signals" script. This way you can quickly and automatically identify breakouts or anticipate them on your favorite Forex pair without manually going through your watchlist searching for breakout opportunities.
Please read the Notes of the script "PriceCatch-Signals Buy Signals" for explanation of its functionality.
FREE VERSION FOREX SET
This Free Forex screener scans a list of 11 Pairs and 2 Crypto (BTCUSD and ETHUSD). This should be enough for most traders. The full version scans all major Forex pairs and more Cryptocurrencies.
Chart resolution vs. Script resolution
It is suggested to set the chart resolution to a lower time-frame than the Screener resolution. For example, if the screener resolution is set to 1 Hour time-frame, set the chart resolution to less than 1 Hour time-frame and run the Screener.
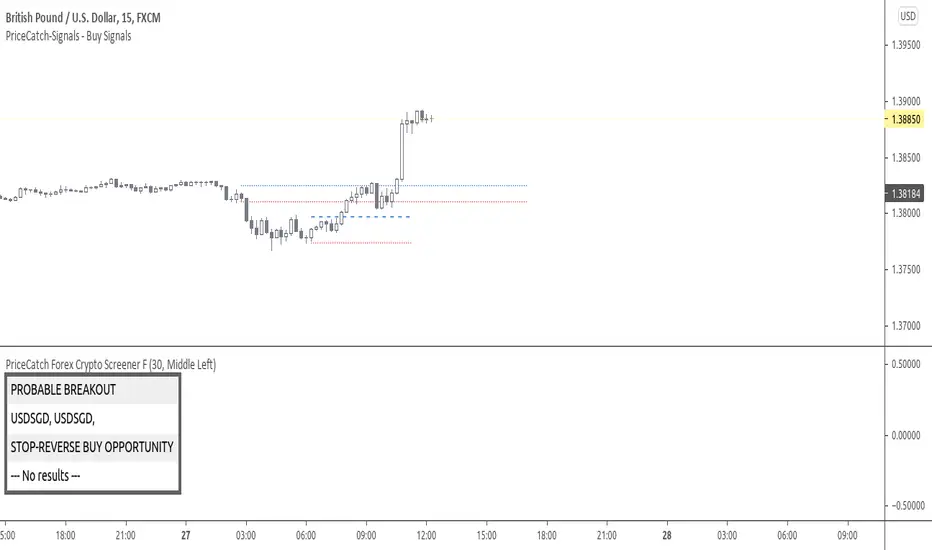
CHART
The Screener runs independently of any symbol displayed on your chart.
NOTE - PRIOR TO USING THIS SCRIPT:
Please remember that the script is shared with absolutely no assurances about usability and any warranties whatsoever and as a responsible trader, please satisfy yourselves thoroughly and use it only if you are convinced it works for you. Remember, you are 100% responsible for your actions. If you understand and accept that, you may use the script.
QUERIES/FEEDBACK
Please PM me or leave comments.
Regards to all and wish everyone all the best with trading.
Search in scripts for "the script"
PriceCatch Malaysia MYX Stocks Screener FHi,
Tradingview community and Malaysian MYX Traders. Warm Greetings.
Malaysia MYX Stocks Screener
I am sharing a script that screens Malaysia MYX stocks for Probable Breakout Buy signal and Stop-Reverse Buy Signal. This script may prove to be useful to traders who trade Malaysia MYX listed stocks.
I have already shared the script "PriceCatch Signals Buy Signals" that marks the following levels on the chart.
Probable Breakout Buy Level
Stop-Reverse Buy Level
While the script "PriceCatch Signals Buy Signals" can be used independently, this script is intended to be used with the script "PriceCatch Signals Buy Signals".
Used together, these two scripts may help you identify probable buy opportunities. The purpose of this script is to help screen stocks quickly without manually going through every stock in your watch list.
Please read the Notes of the script "PriceCatch Signals Buy Signals" for explanation of its functionality.
Stock Set
This Free screener scans a list of 20 stocks. The full version scans a list of 60 stocks. The stocks list will be regularly updated. Care has been taken to include liquid stocks. MYX traders may suggest liquid stocks for inclusion in full version.
Chart resolution vs. Script resolution
I have noticed that if the chart resolution is set to 15 minutes time-frame and the screener resolution is selected as 2 Hours, then the results are correct. However, if the screener resolution is set to 5 minutes, then the results are not accurate. This is not an issue with script. So scanning higher time-frames from a lower time-frame chart works better. My advice however, is better to set the chart resolution to the same interval as screener resolution for sure results.
As usual with price action, longer time-frames produce more reliable signals.
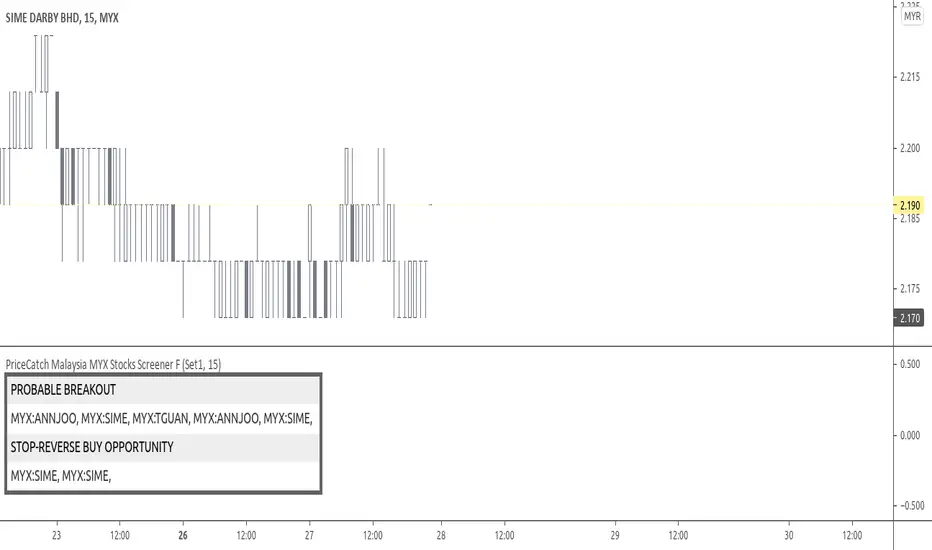
CHART
You can have any stock on your chart, while the screener is scanning the stocks independently. In the above image, chart is set to 45 minutes time frame and stock is ABMB, however screener is screening stocks in 120 minutes time frame and has found GTRONIC.
NOTE - PRIOR TO USING THIS SCRIPT:
Please remember that the script is shared with absolutely no assurances about usability and any warranties whatsoever and as a responsible trader, please satisfy yourselves thoroughly and use it only if you are satisfied it works for you. Remember, you are 100% responsible for your actions. If you understand and accept that, you may use the script.
QUERIES/FEEDBACK
Please PM me.
Regards to all and wish everyone all the best with trading.
Blue Dot Pullback with Bollinger BonusKey FeaturesCore Blue Dot Condition:ATH Pulse: Checks if the highest high in the lookback period (default: 60 bars) is within 1% of the all-time high (over 5000 bars), using recentHigh >= allTimeHigh * 0.99.
Pullback: Price must be below the recent high (close < recentHigh ) but above a 10-period SMA (close > sma10) to ensure a bullish context.
Stochastic Crossover: Stochastic %K must cross above 20 (ta.crossover(k, stochOverSold)).
When these conditions are met, a blue dot is plotted below the bar.
Purple Dot Condition (Bollinger Band Bonus):Includes all blue dot conditions plus the price being within 2% of the lower Bollinger Band (close <= lowerBB * bbProximity).
When met, a purple dot is plotted instead of a blue dot to highlight the stronger signal.
Plotting Logic:Blue dots are plotted only when blueDotCondition is true and purpleDotCondition is false to avoid overlap.
Purple dots are plotted when purpleDotCondition is true (includes Bollinger Band proximity).
Alerts:Added separate alertcondition calls for blue and purple dots, allowing you to set up notifications in TradingView for each signal type.
Visualization:Stochastic %K and %D are plotted in a separate pane for reference, along with the oversold line (20).
You can disable the Stochastic plot by setting display=display.none in the plot functions.
Why This Should WorkCore Setup Alignment: The blue dot condition focuses on the core requirements (ATH, pullback, Stochastic crossover), which should produce signals similar to or more frequently than the ChatGPT script, as it omits the Bollinger Band requirement unless the purple dot condition is met.
Bollinger Band Bonus: The purple dot incorporates the Bollinger Band proximity check (bbNear), matching the ChatGPT script’s additional filter, ensuring purple dots appear when the price is near the lower Bollinger Band.
Flexible ATH Detection: Using recentHigh >= allTimeHigh * 0.99 makes the ATH condition less strict, increasing the likelihood of signals compared to my original script.
How to UseAdd to TradingView:Open the Pine Editor in TradingView.
Copy and paste the script.
Click "Add to Chart" to apply it.
Interpret Dots:Blue Dot: Indicates a stock near an ATH, in a pullback (above 10-period SMA), with a Stochastic crossover above 20. This is the core Dr. Wish setup.
Purple Dot: Same as blue dot but with the price also within 2% of the lower Bollinger Band, suggesting a stronger pullback signal.
Test and Compare:Apply the script to the same stock and timeframe where the ChatGPT script showed blue dots (e.g., NVDA or TSLA on a daily chart).
Check if blue dots appear at similar points and if purple dots appear when the price is near the lower Bollinger Band.
Adjust lookbackATH (e.g., 60 to 100) or bbProximity (e.g., 1.02 to 1.05) if signals are too rare or frequent.
Set Alerts:Use TradingView’s alert feature to create notifications for “Blue Dot Alert” or “Purple Dot Alert” when signals occur.
TroubleshootingIf you’re still not seeing blue or purple dots:Check the Chart: Ensure the stock has recently hit an ATH and pulled back. Test on volatile stocks like NVDA, TSLA, or AAPL on daily or weekly timeframes.
Timeframe Sensitivity: The script may produce fewer signals on lower timeframes (e.g., 1-hour) due to fewer ATH occurrences. Try a daily or weekly chart.
Parameter Tuning: Increase bbProximity (e.g., to 1.05) to allow purple dots for prices slightly further from the lower Bollinger Band, or increase lookbackATH to capture more ATHs.
Compare with ChatGPT Script: Run both scripts on the same chart to identify where signals differ. Share the ticker, timeframe, or a screenshot if you need help debugging specific cases.
Additional NotesThe 10-period SMA in the pullback condition (isPullback) is a simple bullish context filter. You can replace it with another condition (e.g., 20-period SMA or trend filter) if preferred.
The Bollinger Band parameters (bbLength=20, bbMult=2.0) are standard but can be adjusted to match your trading style.
The script uses a 5000-bar lookback for allTimeHigh to approximate a true ATH. If your chart has limited historical data, reduce this value (e.g., to 1000).

PSESS1 - Learn PineScript InputsThis is a script written exclusively for people who are trying to learn Pine Script.
PSESS stands for "Pine Script Educational Script Series" which is a series of scripts that helps Pine Script programmers in 2 ways:
1. Learn Pine Script at more depth by an interactive environment where they can immediately see the effects of any change in the pre-written code and also comparing different lines code having tiny differences so they can grasp the details.
2. Have this script open while coding in order to copy the line they find useful
Pine Script Library couldn't be used for this purpose since this script has educational aspect and needs to be executable individually.
This is Script 1 of PSESS and focuses on inputs in Pine Script.
The script is densly commented in order to make it understandable. here is the outline of the script:
1. Inputs that can be received through the indicator() function
2. 12 possible types of input
3. Input() function arguments: defval - title - tooltip - inline - group - confirm
4. The different display of tooltip when inputs are inline
5. Multiple price and time inputs (on single request or multiple requests)
6. What happens when title argument is not specified
7. References and key points from them

PriceCatch Australia ASX Breakout Stocks Screener FHi,
TradingView community and Australia (ASX) traders. Warm Greetings.
PriceCatch Australia (ASX) Breakout Stocks Screener
I am sharing a script that screens Australia (ASX) stocks for Probable Breakout Buy signal and Stop-Reverse Buy Signal. This script may prove to be useful to traders who trade Australia (ASX) listed stocks.
I have already shared the script "PriceCatch Signals Buy Signals" that marks the following levels on the chart.
Probable Breakout Buy Level
Stop-Reverse Buy Level
While the script "PriceCatch Signals Buy Signals" can be used independently, this script is intended to be used with the script "PriceCatch Signals Buy Signals".
Used together, these two scripts may help you identify probable breakout opportunities. This Screener will help you screen stocks that have broken out of any of the Breakout levels marked by the "PriceCatch Signals Buy Signals" script. This way you can quickly and automatically identify breakout stocks without manually going through every stock in your watchlist searching for breakout signals.
Please read the Notes of the script "PriceCatch Signals Buy Signals" for explanation of its functionality.
STOCKS SET
This Free screener scans a list of 20 stocks. The full version scans a list of 80 stocks. Care has been taken to include liquid stocks and stocks of AUD $10 and above only, to avoid penny stocks.
Chart resolution vs. Script resolution
It is suggested to set the chart resolution to a lower time-frame than the Screener resolution. For example, if the screener resolution is set to 1 Hour time-frame, set the chart resolution to less than 1 Hour time-frame and run the Screener.
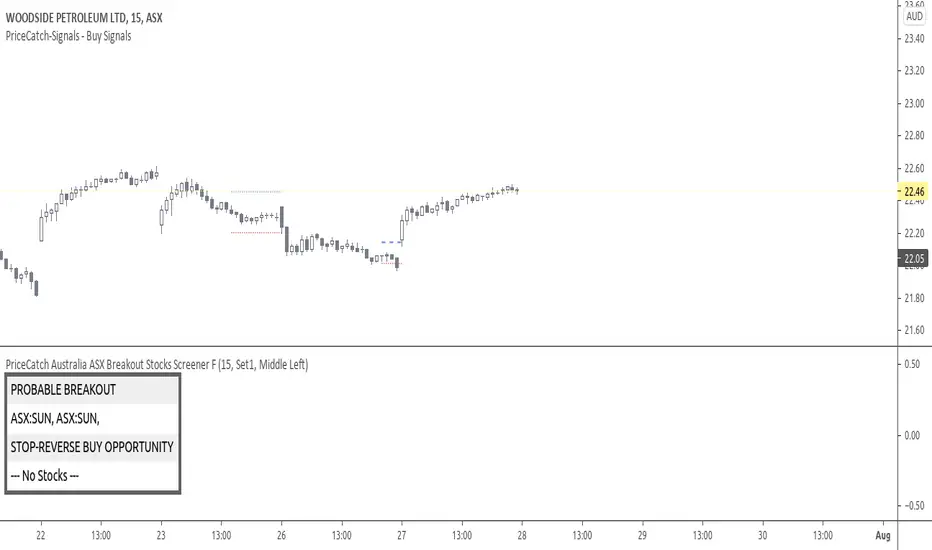
CHART
The Screener runs independently and you may have any other ASX chart on your screen.
NOTE - PRIOR TO USING THIS SCRIPT:
Please remember that the script is shared with absolutely no assurances about usability and any warranties whatsoever and as a responsible trader, please satisfy yourselves thoroughly and use it only if you are satisfied it works for you. Remember, you are 100% responsible for your actions. If you understand and accept that, you may use the script.
QUERIES/FEEDBACK
Please PM me or comment.
Regards to all and wish everyone all the best with trading.
PriceCatch NASDAQ Breakout Stocks Screener FHi,
Tradingview community and NASDAQ traders. Warm Greetings.
NASDAQ Breakout Stocks Screener
I am sharing a script that screens NASDAQ stocks for Probable Breakout Buy signal and Stop-Reverse Buy Signal. This script may prove to be useful to traders who trade NASDAQ listed stocks.
I have already shared the script "PriceCatch Signals Buy Signals" that marks the following levels on the chart.
Probable Breakout Buy Level
Stop-Reverse Buy Level
While the script "PriceCatch Signals Buy Signals" can be used independently, this script is intended to be used with the script "PriceCatch Signals Buy Signals".
Used together, these two scripts may help you identify probable breakout opportunities. This Screener will help you screen stocks that have broken out of any of the Breakout levels marked by the "PriceCatch Signals Buy Signals" script. This way you can quickly and automatically identify breakout stocks without manually going through every stock in your watchlist searching for breakout signals.
Please read the Notes of the script "PriceCatch Signals Buy Signals" for explanation of its functionality.
STOCKS SET
This Free screener scans a list of 20 stocks. The full version scans a list of 160 stocks. Care has been taken to include liquid stocks with over 500K daily volume.
Chart resolution vs. Script resolution
It is suggested to set the chart resolution to a lower time-frame than the Screener resolution. For example, if the screener resolution is set to 1 Hour time-frame, set the chart resolution to less than 1 Hour time-frame and run the Screener.
CHART
The Screener runs independently and you may have any chart on your screen. As you can see chart is showing XLNX and the screener has identified a set of other stocks.
NOTE - PRIOR TO USING THIS SCRIPT:
Please remember that the script is shared with absolutely no assurances about usability and any warranties whatsoever and as a responsible trader, please satisfy yourselves thoroughly and use it only if you are satisfied it works for you. Remember, you are 100% responsible for your actions. If you understand and accept that, you may use the script.
QUERIES/FEEDBACK
Please PM me.
Regards to all and wish everyone all the best with trading.

PriceCatch - EuronextParis-Stocks screenerHi,
Tradingview community. Warm Greetings.
EuronextParis Stocks Screener
I am sharing a script that screens Euronext Paris stocks for Probable Breakout Buy signal and Stop-Reverse Buy Signal. This script may prove to be useful to traders who trade Euronext Paris listed stocks.
I have already shared the script "PriceCatch-Signals - Buy Signals" that marks the following levels on the chart.
Probable Breakout Buy Level
Stop-Reverse Buy Level
While the script "PriceCatch-Signals - Buy Signals" can be used independently, this script is intended to be used with the script "PriceCatch-Signals - Buy Signals".
Used together, these two scripts may help you identify probable buy opportunities. The purpose of this script is to help screen stocks quickly without manually going through every stock in your watchlist.
Please read the Notes of the script "PriceCatch-Signals - Buy Signals" for explanation of its functionality.
Stock Set
As Tradingview limits the number of security function calls, to get around, you have to select Set1 to screen first set of 25 stocks and then select Set2 to screen next set of 25 stocks.
Chart resolution vs. Script resolution
I have noticed that if the chart resolution is set to 15 minutes timeframe and the screener resolution is selected as 2 Hours, then the results are correct. However, if the screener resolution is set to 5 minutes, then the results are not accurate. This is not an issue with script. So scanning higher timeframes from a lower timeframe chart works better. My advice however, is better to set the chart resolution to the same interval as screener resolution for sure results.
As usual with price action, longer time-frames produce more reliable signals.
SOME CHARTS
Chart set to Daily timeframe and shows Derichebourg stock. Screener shows a Stop-Reverse Buy Opportunity on GET.
Example 2
Chart set to 30 min. timeframe and shows Derichebourg stock. Screener shows a Stop-Reverse Buy Opportunity on VIV.
NOTE - PRIOR TO USING THIS SCRIPT:
Please remember that the script is shared with absolutely no assurances about usability and any warranties whatsoever and as a responsible trader, please satisfy yourselves thoroughly and use it only if you are satisfied it works for you. Remember, you are 100% responsible for your actions. If you understand and accept that, you may use the script.
QUERIES/FEEDBACK
Please PM me.
Regards to all and wish everyone all the best with trading.

`security()` revisited [PineCoders]NOTE
The non-repainting technique in this publication that relies on bar states is now deprecated, as we have identified inconsistencies that undermine its credibility as a universal solution. The outputs that use the technique are still available for reference in this publication. However, we do not endorse its usage. See this publication for more information about the current best practices for requesting HTF data and why they work.
█ OVERVIEW
This script presents a new function to help coders use security() in both repainting and non-repainting modes. We revisit this often misunderstood and misused function, and explain its behavior in different contexts, in the hope of dispelling some of the coder lure surrounding it. The function is incredibly powerful, yet misused, it can become a dangerous WMD and an instrument of deception, for both coders and traders.
We will discuss:
• How to use our new `f_security()` function.
• The behavior of Pine code and security() on the three very different types of bars that make up any chart.
• Why what you see on a chart is a simulation, and should be taken with a grain of salt.
• Why we are presenting a new version of a function handling security() calls.
• Other topics of interest to coders using higher timeframe (HTF) data.
█ WARNING
We have tried to deliver a function that is simple to use and will, in non-repainting mode, produce reliable results for both experienced and novice coders. If you are a novice coder, stick to our recommendations to avoid getting into trouble, and DO NOT change our `f_security()` function when using it. Use `false` as the function's last argument and refrain from using your script at smaller timeframes than the chart's. To call our function to fetch a non-repainting value of close from the 1D timeframe, use:
f_security(_sym, _res, _src, _rep) => security(_sym, _res, _src )
previousDayClose = f_security(syminfo.tickerid, "D", close, false)
If that's all you're interested in, you are done.
If you choose to ignore our recommendation and use the function in repainting mode by changing the `false` in there for `true`, we sincerely hope you read the rest of our ramblings before you do so, to understand the consequences of your choice.
Let's now have a look at what security() is showing you. There is a lot to cover, so buckle up! But before we dig in, one last thing.
What is a chart?
A chart is a graphic representation of events that occur in markets. As any representation, it is not reality, but rather a model of reality. As Scott Page eloquently states in The Model Thinker : "All models are wrong; many are useful". Having in mind that both chart bars and plots on our charts are imperfect and incomplete renderings of what actually occurred in realtime markets puts us coders in a place from where we can better understand the nature of, and the causes underlying the inevitable compromises necessary to build the data series our code uses, and print chart bars.
Traders or coders complaining that charts do not reflect reality act like someone who would complain that the word "dog" is not a real dog. Let's recognize that we are dealing with models here, and try to understand them the best we can. Sure, models can be improved; TradingView is constantly improving the quality of the information displayed on charts, but charts nevertheless remain mere translations. Plots of data fetched through security() being modelized renderings of what occurs at higher timeframes, coders will build more useful and reliable tools for both themselves and traders if they endeavor to perfect their understanding of the abstractions they are working with. We hope this publication helps you in this pursuit.
█ FEATURES
This script's "Inputs" tab has four settings:
• Repaint : Determines whether the functions will use their repainting or non-repainting mode.
Note that the setting will not affect the behavior of the yellow plot, as it always repaints.
• Source : The source fetched by the security() calls.
• Timeframe : The timeframe used for the security() calls. If it is lower than the chart's timeframe, a warning appears.
• Show timeframe reminder : Displays a reminder of the timeframe after the last bar.
█ THE CHART
The chart shows two different pieces of information and we want to discuss other topics in this section, so we will be covering:
A — The type of chart bars we are looking at, indicated by the colored band at the top.
B — The plots resulting of calling security() with the close price in different ways.
C — Points of interest on the chart.
A — Chart bars
The colored band at the top shows the three types of bars that any chart on a live market will print. It is critical for coders to understand the important distinctions between each type of bar:
1 — Gray : Historical bars, which are bars that were already closed when the script was run on them.
2 — Red : Elapsed realtime bars, i.e., realtime bars that have run their course and closed.
The state of script calculations showing on those bars is that of the last time they were made, when the realtime bar closed.
3 — Green : The realtime bar. Only the rightmost bar on the chart can be the realtime bar at any given time, and only when the chart's market is active.
Refer to the Pine User Manual's Execution model page for a more detailed explanation of these types of bars.
B — Plots
The chart shows the result of letting our 5sec chart run for a few minutes with the following settings: "Repaint" = "On" (the default is "Off"), "Source" = `close` and "Timeframe" = 1min. The five lines plotted are the following. They have progressively thinner widths:
1 — Yellow : A normal, repainting security() call.
2 — Silver : Our recommended security() function.
3 — Fuchsia : Our recommended way of achieving the same result as our security() function, for cases when the source used is a function returning a tuple.
4 — White : The method we previously recommended in our MTF Selection Framework , which uses two distinct security() calls.
5 — Black : A lame attempt at fooling traders that MUST be avoided.
All lines except the first one in yellow will vary depending on the "Repaint" setting in the script's inputs. The first plot does not change because, contrary to all other plots, it contains no conditional code to adapt to repainting/no-repainting modes; it is a simple security() call showing its default behavior.
C — Points of interest on the chart
Historical bars do not show actual repainting behavior
To appreciate what a repainting security() call will plot in realtime, one must look at the realtime bar and at elapsed realtime bars, the bars where the top line is green or red on the chart at the top of this page. There you can see how the plots go up and down, following the close value of each successive chart bar making up a single bar of the higher timeframe. You would see the same behavior in "Replay" mode. In the realtime bar, the movement of repainting plots will vary with the source you are fetching: open will not move after a new timeframe opens, low and high will change when a new low or high are found, close will follow the last feed update. If you are fetching a value calculated by a function, it may also change on each update.
Now notice how different the plots are on historical bars. There, the plot shows the close of the previously completed timeframe for the whole duration of the current timeframe, until on its last bar the price updates to the current timeframe's close when it is confirmed (if the timeframe's last bar is missing, the plot will only update on the next timeframe's first bar). That last bar is the only one showing where the plot would end if that timeframe's bars had elapsed in realtime. If one doesn't understand this, one cannot properly visualize how his script will calculate in realtime when using repainting. Additionally, as published scripts typically show charts where the script has only run on historical bars, they are, in fact, misleading traders who will naturally assume the script will behave the same way on realtime bars.
Non-repainting plots are more accurate on historical bars
Now consider this chart, where we are using the same settings as on the chart used to publish this script, except that we have turned "Repainting" off this time:
The yellow line here is our reference, repainting line, so although repainting is turned off, it is still repainting, as expected. Because repainting is now off, however, plots on historical bars show the previous timeframe's close until the first bar of a new timeframe, at which point the plot updates. This correctly reflects the behavior of the script in the realtime bar, where because we are offsetting the series by one, we are always showing the previously calculated—and thus confirmed—higher timeframe value. This means that in realtime, we will only get the previous timeframe's values one bar after the timeframe's last bar has elapsed, at the open of the first bar of a new timeframe. Historical and elapsed realtime bars will not actually show this nuance because they reflect the state of calculations made on their close , but we can see the plot update on that bar nonetheless.
► This more accurate representation on historical bars of what will happen in the realtime bar is one of the two key reasons why using non-repainting data is preferable.
The other is that in realtime, your script will be using more reliable data and behave more consistently.
Misleading plots
Valiant attempts by coders to show non-repainting, higher timeframe data updating earlier than on our chart are futile. If updates occur one bar earlier because coders use the repainting version of the function, then so be it, but they must then also accept that their historical bars are not displaying information that is as accurate. Not informing script users of this is to mislead them. Coders should also be aware that if they choose to use repainting data in realtime, they are sacrificing reliability to speed and may be running a strategy that behaves very differently from the one they backtested, thus invalidating their tests.
When, however, coders make what are supposed to be non-repainting plots plot artificially early on historical bars, as in examples "c4" and "c5" of our script, they would want us to believe they have achieved the miracle of time travel. Our understanding of the current state of science dictates that for now, this is impossible. Using such techniques in scripts is plainly misleading, and public scripts using them will be moderated. We are coding trading tools here—not video games. Elementary ethics prescribe that we should not mislead traders, even if it means not being able to show sexy plots. As the great Feynman said: You should not fool the layman when you're talking as a scientist.
You can readily appreciate the fantasy plot of "c4", the thinnest line in black, by comparing its supposedly non-repainting behavior between historical bars and realtime bars. After updating—by miracle—as early as the wide yellow line that is repainting, it suddenly moves in a more realistic place when the script is running in realtime, in synch with our non-repainting lines. The "c5" version does not plot on the chart, but it displays in the Data Window. It is even worse than "c4" in that it also updates magically early on historical bars, but goes on to evaluate like the repainting yellow line in realtime, except one bar late.
Data Window
The Data Window shows the values of the chart's plots, then the values of both the inside and outside offsets used in our calculations, so you can see them change bar by bar. Notice their differences between historical and elapsed realtime bars, and the realtime bar itself. If you do not know about the Data Window, have a look at this essential tool for Pine coders in the Pine User Manual's page on Debugging . The conditional expressions used to calculate the offsets may seem tortuous but their objective is quite simple. When repainting is on, we use this form, so with no offset on all bars:
security(ticker, i_timeframe, i_source )
// which is equivalent to:
security(ticker, i_timeframe, i_source)
When repainting is off, we use two different and inverted offsets on historical bars and the realtime bar:
// Historical bars:
security(ticker, i_timeframe, i_source )
// Realtime bar (and thus, elapsed realtime bars):
security(ticker, i_timeframe, i_source )
The offsets in the first line show how we prevent repainting on historical bars without the need for the `lookahead` parameter. We use the value of the function call on the chart's previous bar. Since values between the repainting and non-repainting versions only differ on the timeframe's last bar, we can use the previous value so that the update only occurs on the timeframe's first bar, as it will in realtime when not repainting.
In the realtime bar, we use the second call, where the offsets are inverted. This is because if we used the first call in realtime, we would be fetching the value of the repainting function on the previous bar, so the close of the last bar. What we want, instead, is the data from the previous, higher timeframe bar , which has elapsed and is confirmed, and thus will not change throughout realtime bars, except on the first constituent chart bar belonging to a new higher timeframe.
After the offsets, the Data Window shows values for the `barstate.*` variables we use in our calculations.
█ NOTES
Why are we revisiting security() ?
For four reasons:
1 — We were seeing coders misuse our `f_secureSecurity()` function presented in How to avoid repainting when using security() .
Some novice coders were modifying the offset used with the history-referencing operator in the function, making it zero instead of one,
which to our horror, caused look-ahead bias when used with `lookahead = barmerge.lookahead_on`.
We wanted to present a safer function which avoids introducing the dreaded "lookahead" in the scripts of unsuspecting coders.
2 — The popularity of security() in screener-type scripts where coders need to use the full 40 calls allowed per script made us want to propose
a solid method of allowing coders to offer a repainting/no-repainting choice to their script users with only one security() call.
3 — We wanted to explain why some alternatives we see circulating are inadequate and produce misleading behavior.
4 — Our previous publication on security() focused on how to avoid repainting, yet many other considerations worthy of attention are not related to repainting.
Handling tuples
When sending function calls that return tuples with security() , our `f_security()` function will not work because Pine does not allow us to use the history-referencing operator with tuple return values. The solution is to integrate the inside offset to your function's arguments, use it to offset the results the function is returning, and then add the outside offset in a reassignment of the tuple variables, after security() returns its values to the script, as we do in our "c2" example.
Does it repaint?
We're pretty sure Wilder was not asked very often if RSI repainted. Why? Because it wasn't in fashion—and largely unnecessary—to ask that sort of question in the 80's. Many traders back then used daily charts only, and indicator values were calculated at the day's close, so everybody knew what they were getting. Additionally, indicator values were calculated by generally reputable outfits or traders themselves, so data was pretty reliable. Today, almost anybody can write a simple indicator, and the programming languages used to write them are complex enough for some coders lacking the caution, know-how or ethics of the best professional coders, to get in over their heads and produce code that does not work the way they think it does.
As we hope to have clearly demonstrated, traders do have legitimate cause to ask if MTF scripts repaint or not when authors do not specify it in their script's description.
► We recommend that authors always use our `f_security()` with `false` as the last argument to avoid repainting when fetching data dependent on OHLCV information. This is the only way to obtain reliable HTF data. If you want to offer users a choice, make non-repainting mode the default, so that if users choose repainting, it will be their responsibility. Non-repainting security() calls are also the only way for scripts to show historical behavior that matches the script's realtime behavior, so you are not misleading traders. Additionally, non-repainting HTF data is the only way that non-repainting alerts can be configured on MTF scripts, as users of MTF scripts cannot prevent their alerts from repainting by simply configuring them to trigger on the bar's close.
Data feeds
A chart at one timeframe is made up of multiple feeds that mesh seamlessly to form one chart. Historical bars can use one feed, and the realtime bar another, which brokers/exchanges can sometimes update retroactively so that elapsed realtime bars will reappear with very slight modifications when the browser's tab is refreshed. Intraday and daily chart prices also very often originate from different feeds supplied by brokers/exchanges. That is why security() calls at higher timeframes may be using a completely different feed than the chart, and explains why the daily high value, for example, can vary between timeframes. Volume information can also vary considerably between intraday and daily feeds in markets like stocks, because more volume information becomes available at the end of day. It is thus expected behavior—and not a bug—to see data variations between timeframes.
Another point to keep in mind concerning feeds it that when you are using a repainting security() plot in realtime, you will sometimes see discrepancies between its plot and the realtime bars. An artefact revealing these inconsistencies can be seen when security() plots sometimes skip a realtime chart bar during periods of high market activity. This occurs because of races between the chart and the security() feeds, which are being monitored by independent, concurrent processes. A blue arrow on the chart indicates such an occurrence. This is another cause of repainting, where realtime bar-building logic can produce different outcomes on one closing price. It is also another argument supporting our recommendation to use non-repainting data.
Alternatives
There is an alternative to using security() in some conditions. If all you need are OHLC prices of a higher timeframe, you can use a technique like the one Duyck demonstrates in his security free MTF example - JD script. It has the great advantage of displaying actual repainting values on historical bars, which mimic the code's behavior in the realtime bar—or at least on elapsed realtime bars, contrary to a repainting security() plot. It has the disadvantage of using the current chart's TF data feed prices, whereas higher timeframe data feeds may contain different and more reliable prices when they are compiled at the end of the day. In its current state, it also does not allow for a repainting/no-repainting choice.
When `lookahead` is useful
When retrieving non-price data, or in special cases, for experiments, it can be useful to use `lookahead`. One example is our Backtesting on Non-Standard Charts: Caution! script where we are fetching prices of standard chart bars from non-standard charts.
Warning users
Normal use of security() dictates that it only be used at timeframes equal to or higher than the chart's. To prevent users from inadvertently using your script in contexts where it will not produce expected behavior, it is good practice to warn them when their chart is on a higher timeframe than the one in the script's "Timeframe" field. Our `f_tfReminderAndErrorCheck()` function in this script does that. It can also print a reminder of the higher timeframe. It uses one security() call.
Intrabar timeframes
security() is not supported by TradingView when used with timeframes lower than the chart's. While it is still possible to use security() at intrabar timeframes, it then behaves differently. If no care is taken to send a function specifically written to handle the successive intrabars, security() will return the value of the last intrabar in the chart's timeframe, so the last 1H bar in the current 1D bar, if called at "60" from a "D" chart timeframe. If you are an advanced coder, see our FAQ entry on the techniques involved in processing intrabar timeframes. Using intrabar timeframes comes with important limitations, which you must understand and explain to traders if you choose to make scripts using the technique available to others. Special care should also be taken to thoroughly test this type of script. Novice coders should refrain from getting involved in this.
█ TERMINOLOGY
Timeframe
Timeframe , interval and resolution are all being used to name the concept of timeframe. We have, in the past, used "timeframe" and "resolution" more or less interchangeably. Recently, members from the Pine and PineCoders team have decided to settle on "timeframe", so from hereon we will be sticking to that term.
Multi-timeframe (MTF)
Some coders use "multi-timeframe" or "MTF" to name what are in fact "multi-period" calculations, as when they use MAs of progressively longer periods. We consider that a misleading use of "multi-timeframe", which should be reserved for code using calculations actually made from another timeframe's context and using security() , safe for scripts like Duyck's one mentioned earlier, or TradingView's Relative Volume at Time , which use a user-selected timeframe as an anchor to reset calculations. Calculations made at the chart's timeframe by varying the period of MAs or other rolling window calculations should be called "multi-period", and "MTF-anchored" could be used for scripts that reset calculations on timeframe boundaries.
Colophon
Our script was written using the PineCoders Coding Conventions for Pine .
The description was formatted using the techniques explained in the How We Write and Format Script Descriptions PineCoders publication.
Snippets were lifted from our MTF Selection Framework , then massaged to create the `f_tfReminderAndErrorCheck()` function.
█ THANKS
Thanks to apozdnyakov for his help with the innards of security() .
Thanks to bmistiaen for proofreading our description.
Look first. Then leap.

Smart Divergence Engine [ChartNation]SMART DIVERGENCE ENGINE — REPAINTING-PROOF RSI DIVERGENCE WITH EXHAUSTION CONFIRMATION
═══════════════════════════════════════════
Smart Divergence Engine solves three critical problems that plague free RSI divergence indicators:
PROBLEM 1: REPAINTING DIVERGENCES
Most divergence scripts detect divergence in real-time as bars form. This causes signals to appear, disappear, and reappear unpredictably—making them unusable for alerts or systematic trading.
OUR SOLUTION: Pivot-Locked Detection
Smart Divergence Engine evaluates RSI at the exact bar where price structure confirms (rsi ), not at the current bar. Once a divergence prints, it NEVER disappears. This is implemented via:
Full swing confirmation (Pivot Left + Pivot Right bars must complete)
RSI evaluation at historical bar: rsi , not rsi
Divergence triggers AFTER structure lock, not during formation
Technical implementation: The script stores RSI values at confirmed pivot bars using var floats (lowRsiPrev, lowRsiCurr, highRsiPrev, highRsiCurr), then compares these locked values when new pivots confirm. This prevents any possibility of historical repaint.
PROBLEM 2: FALSE POSITIVE OVERLOAD
Divergence scripts trigger on ANY price-RSI mismatch, flooding charts with weak signals during choppy conditions. No filtering means traders must manually screen out noise.
OUR SOLUTION: Shark Fin Exhaustion Filter
Before any divergence can be considered actionable, Smart Divergence Engine requires RSI to demonstrate genuine momentum exhaustion through our proprietary "Shark Fin" detection:
Shark Fin Logic (Not Found in Free Scripts):
RSI must pierce the outer volatility band by a configurable buffer (default 1.5 RSI points)
RSI must re-enter the band with directional confirmation (positive slope for bullish, negative slope for bearish)
Band width must exceed minimum standard deviation threshold (volatility qualification)
Cooldown period enforced (default 25 bars) to prevent signal clustering
This multi-condition filter dramatically reduces false divergences by requiring RSI to physically demonstrate exhaustion BEFORE structure confirmation matters.
Technical implementation: The Shark Fin state machine uses boolean flags (bullFinForming, bearFinForming) to track when RSI is stretched beyond bands, then validates re-entry using ta.crossover(rsi, lower) / ta.crossunder(rsi, upper) with slope checks (ta.change(rsi) > 0 / < 0) and volatility gates (dev >= finMinDev).
PROBLEM 3: NO VOLATILITY CONTEXT
Divergence scripts use fixed RSI levels (30/70 or similar) that fail to adapt to changing market conditions. What's "overbought" in a low-volatility regime differs drastically from high-volatility conditions.
OUR SOLUTION: Adaptive Volatility Bands
Smart Divergence Engine calculates dynamic overbought/oversold zones using:
34-period SMA of RSI as basis
1.618 standard deviation multiplier (golden ratio expansion)
Real-time band expansion/contraction based on RSI volatility
The bands provide three advantages:
Shark Fin events only qualify when RSI breaches ADAPTIVE thresholds, not arbitrary fixed levels
Band width (standard deviation) serves as volatility filter—narrow bands = low conviction moves get rejected
50-line midline provides regime context (above 50 = bullish bias, below 50 = bearish bias)
Technical implementation: basis = ta.sma(rsi, 34), dev = ta.stdev(rsi, 34), upper/lower = basis ± dev * 1.618. Shark Fin logic requires rsi < (lower - finBuffer) or rsi > (upper + finBuffer) to trigger, ensuring exhaustion is measured relative to CURRENT volatility, not historical constants.
═══════════════════════════════════════════
METHODOLOGY COMPARISON VS FREE ALTERNATIVES
═══════════════════════════════════════════
STANDARD DIVERGENCE SCRIPTS:
Detection timing: Real-time (current bar)
Historical stability: Repaints continuously
Signal filtering: None or minimal
Volatility adaptation: Fixed levels (30/70)
Exhaustion confirmation: Not implemented
Confirmation layers: 1 (divergence only)
Alert reliability: Unreliable (signals disappear)
SMART DIVERGENCE ENGINE:
Detection timing: Pivot-confirmed (rsi )
Historical stability: Locked at structure bar
Signal filtering: Shark Fin + cooldown + stdev gate
Volatility adaptation: Dynamic bands (34-SMA + 1.618σ)
Exhaustion confirmation: Required via Shark Fin
Confirmation layers: 3 (structure + exhaustion + volatility)
Alert reliability: Stable (never repaints)
═══════════════════════════════════════════
TECHNICAL SPECIFICATIONS
═══════════════════════════════════════════
RSI ENGINE:
Base calculation: ta.rsi(src, 14)
Smoothing: ta.rma(rsiRaw, 2) — reduces whipsaw noise
Source: Configurable (default close)
VOLATILITY BANDS:
Basis: 34-period SMA of RSI
Multiplier: 1.618 (golden ratio)
Upper band: basis + (stdev * 1.618)
Lower band: basis - (stdev * 1.618)
Purpose: Creates adaptive overbought/oversold zones
DIVERGENCE DETECTION:
Pivot confirmation: 10 left bars + 10 right bars (default)
RSI evaluation: Locked at rsi (historical bar, never current)
Bullish divergence: price lower low + RSI higher low
Bearish divergence: price higher high + RSI lower high
Rendering: Lines drawn between last two confirmed pivots with labels
SHARK FIN EXHAUSTION FILTER:
Depth buffer: 1.5 RSI points (penetration threshold beyond band)
Min band stdev: 1.0 (volatility qualification)
Cooldown: 25 bars minimum between Shark Fin confirmations
Slope validation: Requires ta.change(rsi) > 0 (bullish) or < 0 (bearish)
State tracking: Boolean flags prevent premature confirmations
VISUAL CUSTOMIZATION:
Beauty Mode: Six-layer gradient fill anchored at 50-line
• Purple regime (above 50) with configurable opacity
• Green regime (below 50) with configurable opacity
• Gradient layers: 33%, 66%, 100% intensity
Divergence lines: Glow effect (6px) + core line (3px), both configurable
Shark Fin rendering: 20% fill between RSI and violated band (ephemeral)
Labels: Compact "Bull"/"Bear" markers with dot indicators
═══════════════════════════════════════════
ALERT SYSTEM
═══════════════════════════════════════════
Four distinct alert conditions (configure once, fires on all intervals):
"RSI Shark Fin — Bullish"
Triggers when: RSI re-enters lower band from below with slope + stdev + cooldown confirmation
Use case: Momentum exhaustion at oversold extreme
Reliability: No repaint (confirmation locked at re-entry bar)
"RSI Shark Fin — Bearish"
Triggers when: RSI re-enters upper band from above with slope + stdev + cooldown confirmation
Use case: Momentum exhaustion at overbought extreme
Reliability: No repaint (confirmation locked at re-entry bar)
"Bullish Divergence (Panel)"
Triggers when: Pivot-confirmed bullish divergence completes (price LL + RSI HL)
Timing: Fires AFTER Pivot Right bars complete (delayed but stable)
Reliability: Never repaints (divergence locked at rsi )
"Bearish Divergence (Panel)"
Triggers when: Pivot-confirmed bearish divergence completes (price HH + RSI LH)
Timing: Fires AFTER Pivot Right bars complete (delayed but stable)
Reliability: Never repaints (divergence locked at rsi )
═══════════════════════════════════════════
TRADING IMPLEMENTATION
═══════════════════════════════════════════
CONFLUENCE FRAMEWORK:
Highest-probability setups occur when three conditions align:
Bullish Setup:
Shark Fin confirms below lower band (exhaustion)
Bullish divergence prints at pivot (structure)
RSI reclaims 50 line (regime shift to bullish)
→ Entry consideration at next price structure (support, swing low)
Bearish Setup:
Shark Fin confirms above upper band (exhaustion)
Bearish divergence prints at pivot (structure)
RSI loses 50 line (regime shift to bearish)
→ Entry consideration at next price structure (resistance, swing high)
TREND CONTEXT:
Strong uptrends: Prioritize bullish divergence + lower band Shark Fins (buy dips)
Strong downtrends: Prioritize bearish divergence + upper band Shark Fins (sell rallies)
Range-bound markets: Use 50-line crossovers as additional confirmation filter
RISK MANAGEMENT:
Smart Divergence Engine provides CONTEXT, not entries:
Wait for price confirmation (engulfing candle, rejection wick, structure break)
Place stops below/above pivot structure that triggered divergence
Size positions based on distance to invalidation level
Divergence + Shark Fin = elevated probability, not certainty
═══════════════════════════════════════════
CONFIGURATION PARAMETERS
═══════════════════════════════════════════
RSI SETTINGS:
RSI Length: 14 (default, standard momentum window)
Price Source: close (configurable to any price source)
Note: 2-period RMA smoothing is hardcoded (reduces noise)
VOLATILITY BAND SETTINGS:
Band Length: 34 (SMA period for RSI basis)
Band Multiplier: 1.618 (golden ratio, adjustable)
Show Bands: Toggle visibility (true/false)
DIVERGENCE SETTINGS:
Pivot Left: 10 bars (left-side swing confirmation)
Pivot Right: 10 bars (right-side swing confirmation)
Overbought Level: 68 (reference line, does not affect logic)
Oversold Level: 32 (reference line, does not affect logic)
SHARK FIN SETTINGS:
Fin Depth Buffer: 1.5 RSI points (penetration threshold)
Min Band Stdev: 1.0 (volatility qualification gate)
Min Bars Between Fins: 25 (cooldown period)
VISUAL SETTINGS (Beauty Mode):
Enable Beauty Mode: true/false (gradient rendering)
Divergence Glow: true/false (glow effect on lines)
Glow Width: 3-10 px (glow layer thickness)
Main Line Width: 1-6 px (divergence core line)
Top Color: Purple (configurable, above-50 regime)
Bottom Color: Green (configurable, below-50 regime)
Top Opacity: 0-100% (gradient base transparency)
Bottom Opacity: 0-100% (gradient base transparency)
═══════════════════════════════════════════
PERFORMANCE & LIMITATIONS
═══════════════════════════════════════════
RESOURCE ALLOCATION:
max_lines_count: 500 (divergence + Shark Fin lines)
max_labels_count: 500 (divergence markers)
max_bars_back: 500 (historical pivot lookback)
Suitable for most timeframes; reduce limits if performance degrades on low-end devices
SIGNAL TIMING:
Divergences print AFTER Pivot Right bars complete. This is intentional:
Delayed signals are more reliable than real-time signals
Structure confirmation requires waiting for swing completion
Users demanding instant signals should use free real-time divergence indicators
Users demanding reliable signals that never disappear should use this
PANEL VS OVERLAY:
This is the panel version (overlay=false):
Renders in separate pane below price chart
RSI, bands, divergence lines, and Shark Fin fills appear in this pane
For price-chart annotations, use the companion overlay version (same logic, different rendering)
═══════════════════════════════════════════
This script implements proprietary methodology not available in regular community scripts:
REPAINTING-PROOF ARCHITECTURE
The pivot-locked detection system (rsi evaluation) is a non-trivial implementation that requires:
State management across bars using var variables
Historical RSI value storage at pivot confirmation
Divergence comparison between stored values (not current bar)
This architecture eliminates the #1 complaint with free divergence indicators: disappearing signals.
SHARK FIN EXHAUSTION LOGIC
The multi-condition state machine that validates momentum exhaustion is not found in free scripts:
Penetration threshold (buffer beyond band)
Directional slope confirmation on re-entry
Volatility gate (minimum standard deviation)
Cooldown enforcement (prevents clustering)
This filter layer was developed through extensive backtesting to reduce false divergences during choppy conditions.
ADAPTIVE VOLATILITY FRAMEWORK
The dynamic band system (34-SMA + 1.618σ) provides context-aware overbought/oversold detection:
Bands expand in volatile markets → signals adapt to conditions
Bands contract in ranging markets → tighter detection thresholds
50-line regime framework → directional bias context
This approach outperforms fixed-level systems (30/70) that ignore market context.
CONFLUENCE METHODOLOGY
The three-layer confirmation system (structure + exhaustion + volatility) was engineered to answer: "When is a divergence actually tradeable?" Free scripts detect divergence and stop there. Smart Divergence Engine asks: "Did RSI show exhaustion? Is volatility sufficient? Did structure confirm?"
This level of methodological depth—combined with repainting-proof architecture and professional-grade visual implementation—justifies closed-source protection and paid access.
═══════════════════════════════════════════
Smart Divergence Engine is engineered for traders who demand institutional-grade divergence detection without the noise, repainting, and false positives that plague free alternatives.
Access is restricted to maintain signal quality as methodology evolves.

TradeChartist Tantalizer Pro™TradeChartist Tantalizer Pro is an extensive set of trading Indicators, Signal generators and Utilities all packed into 1 script. The script's visually appealing design and its functionality offers a pleasing experience for the users, thereby complementing their analysis and helps understand asset's price action better.
What does ™TradeChartist Tantalizer Pro do?
1. MA Tantalizer plots Moving Averages Tantalizer (Fishnet or Tantalized) based on user selection from a dropdown of 10 MAs (SMA, EMA, Zero-Lag EMA, SMMA, WMA, DEMA, TEMA, VIDYA (Variable Index DYnamic Average), T3 MA (developed by Tim Tillson featured in his article "Better Moving Averages" in 1998), Modified T3 MA). If length input is 10, Tantalizer plots 20 MA plots ranging from 10 MA to 200 MA. The Tantalized MAs help the traders to visually spot price trends and along with other indicators within the script, helps make an informed trade decision. 20 MA plots can be individually plotted or hidden from the indicator settings.
2. Plots two MAs based on user input length and timeframe which helps detect MA crosses as shown below.
3. Generates Intensity framework based Signals with recommended Stop Loss (trails with Equilibrium Line) along with Intensity Bands plot. (disables MA Tantalizer)
4. Plots Intensity candles to help spot trend and trend changes.
5. Generates TradeChartist's Rubicon framework based signals with recommended Stop Loss (trails and reverses trade when closes below or above, based on trade direction) along with Rubicon Environment plot.
6. Offers RSI color candles, Automatic Levels Generator in the toolkit to help traders visually spot RSI changes and Support/Resistance levels on chart. RSI Color Candles is a very helpful tool especially in spotting price trends on Heikin Ashi charts.
The sheer number of interesting things that can be done with this script from plotting visually engaging MA Tantalizer, detecting MA crosses not just on chart Timeframe, but also crosses between MAs of different timeframes, switching between Rubicon and Intensity environments, switching between RSI and Intensity color candles to plotting Support/Resistance levels using Automatic Levels Generator, makes this script quite versatile and a real Tantalizer.
This is not a free to use indicator. Get in touch with me (PM me directly if you would like trial access to the indicator before deciding to take lifetime access to this script)
Premium Scripts - Trial access and Information
Trial access offered on all Premium scripts.
PM me directly to request trial access to the scripts or for more information.

Weis zigzag delta Jayy Dec 09 19This is an update of my Weis Wave script. The script is protected however you do not need permission to use the script. There are additions to this script from the one posted here: Please read the notes associated with that script as well as the videos.
Watch the following video to familiarize yourself with the use of both Weis scripts:
Jayy

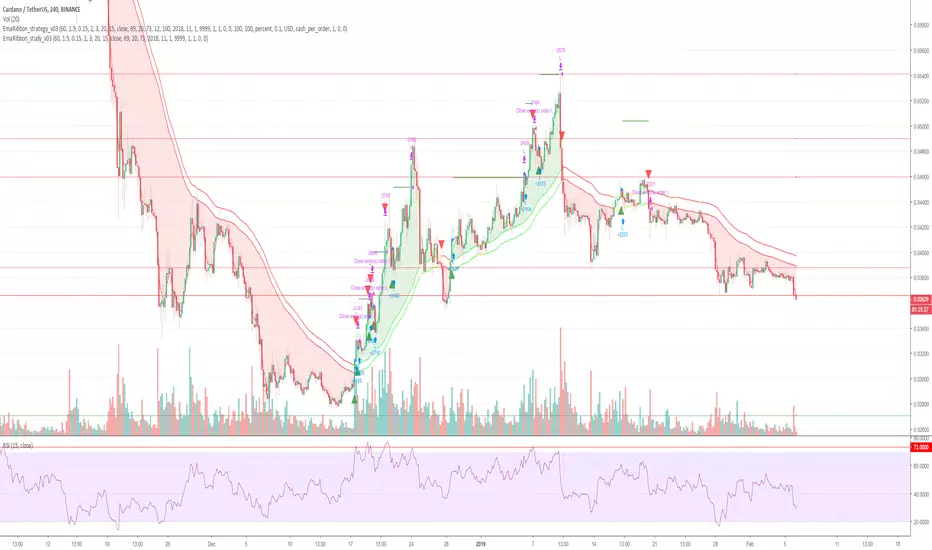
Cryptocurrency trend following EMA Ribbon LONG only studyThis strategy is based on EMA Ribbon and uses multiple indicators to find optimal time to enter/exit the trade and filter out false signals. The script with default setting is developed mainly for trading altcoins/stable coin pair such as ADA(USDT etc on 4h timeframe but it can be applied to any pair/any timeframe with some settings adjustments.
For plot on chart features make sure that you have both study and strategy scripts on chart with same settings.
Strategy settings description:
1. Signal EMA Length - Value for exponencial moving average (slowest from EMA Ribbon)
1a. Buy price toleration (%) - Price deviation for filtering bounces of EMA - price must close defined percents above EMA to open long trade
1b. Sell price toleration (%) - Price deviation for filtering bounces of EMA - price must close defined percents bellow EMA to close long trade
1c. EMA deelay - EMA id delayed by defined bars for smoothening
2. Filter by Fast EMA - Strategy filters signals to prevent buy while coin is dropping
2a. Fast EMA Length - Value for fast exponencial moving average
3. Filter by SMA - Strategy filters signals to confirm trend change
3a. SMA Length - Value for simple moving average
4. Filter by RSI - Strategy filters signals to prevent buing/selling overbought/oversold coins
4a. RSI Length - Length of RSI identificator
4b. RSI Source candle - What price of candle is used for RSI calculation (open, close, high, low)
4c. RSI Long condition - When buy, RSI indicator must be below this value to prevent of buying already overbought coin
4d. RSI Short condition - When sell, RSI indicator must be above this value to prevent of selling already oversold coin
5. RSI Close Trade Condition - Strategy sell coin once RSI reach defined value
5a. RSI close trade condition - Sell once RSI indicator acquires defined value
6. Close trade by Take Profit or Stop Loss Condition (STRATEGY ONLY) - Strategy sell coin once defined take profit / stoploss level is reached
6a. Take Profit (%) - Take profit value in percent
6b. Stop Loss (%) - Stop loss value in percent
6c. Plot targets on chart - defined targets will be plotted as lines on chart
7. Date range from
7a From Year - To run strategy in interval
7b From Month - To run strategy in interval
7c From Day - To run strategy in interval
8. Date range to
8a To Year - To run strategy in interval
8b To Month - To run strategy in interval
8c To Day - To run strategy in interval
9. Wait to confirm the signal
9a Wait candless to buy - strategy will wait defined candless to confirm the signal before buy
9b Wait candless to sell - strategy will wait defined candless to confirm the signal before sell
10. Plotting on chart (STUDY ONLY)
10a Plot signal line channel with bows on chart
10b Plot simple moving average on chart
10c Plot EMA Ribbon on chart
10d Plot recent support and resistance levels on chart
11. Show Every signal (STUDY ONLY) - Unchecked shows only first signal based on strategy. But if you use take profit/stoploss settings within your bot, you might want to rebuy on next signal. Checked shows signal on each candle.
Throw on chart also buld-in RSI indicator and set the same as strategy
Notice that there might be false signals, especially when the coin is not trending or is strongly manipulated. Overall strategy is profitable though. You just take some minor loses and wont miss the big move.
You may also consider to compare buy&hold return vs profit from trading this strategy. In downtrend as we have seen recently, profit may not be as high as you expect but it is still much better than just hold and hope.
You can use the strategy script for fine tunning settings and find best settings for yourself.
Study script helps you to automate trading with use of alerts perharps with 3commas bot or even trade manually based on email/sms notification setted by tradingview
Notice that study script does not handle takeprofit/stoploss order. That is why sell arrows could be plotted by study script later than strategy script. To rebuy after takeprofit/stop-loss use "11. Show Every signal (STUDY ONLY)" setting
Make sure that you keep same settings for strategy and study scripts.
If you need any help with settings do not hesitate to ask. I would also appriciate any feedback and ideas how to improve this script.
Here is backtest result from 1. Nov 2018 using constant 100USD Buy ammount:
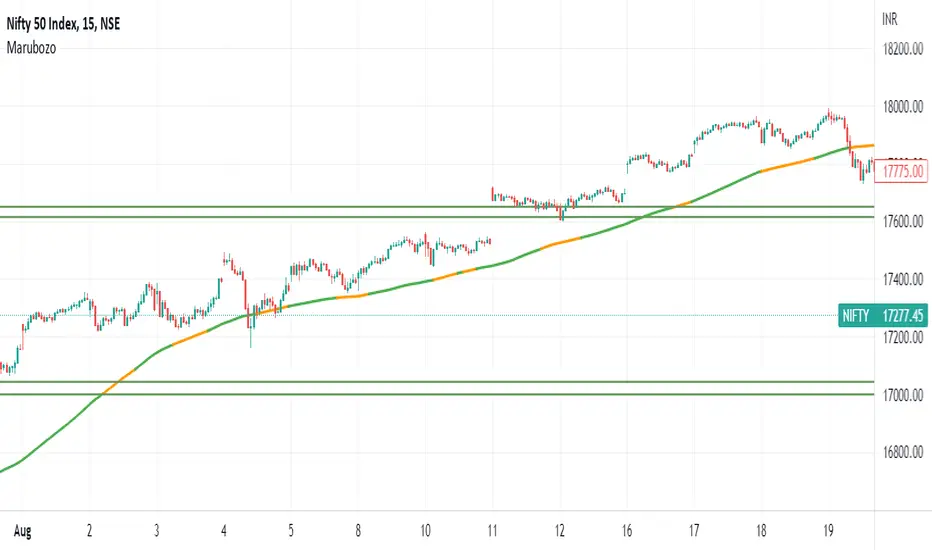
MarubozuMarubozu:
This code is written to identify the Marubozu candles in three different timeframe (30, 45, 60) - and there is an option given to the user for modifying the timeframe according to their wish.
Step to work with this script:
1. The three timeframe will work like this, If you select in chart 15mins - the three levels that you can select are 30, 45, 60, but if you select higher value like 30mins in the chart - you cannot select 45mins as there is a restriction on the code as it will display on the script of divisible by the timeframe selected in the chart.
2. Moving Average 100 is used along with the trend to see whether the immediate trend of the script is negative or positive which will help in taking the script for long or short.
Rules:
1. Always select the timeframe as 15mins in the chart and get the levels from the script.. Mark them in your chart as permanent levels and you can hide the script for further use, and don't reduce the timeframe to 5mins as the level gets changed.
2. The script will identify the High and low of the Marubozu and draws the horizontal line to help the users to see the support and resistance for the script.
3. Always try to trade above the 100sma and marubozu levels at the bottom - and don't look out for the trade where the SMA is very near to resistance or support (when you are short)
CVD - Cumulative Volume Delta (Chart)█ OVERVIEW
This indicator displays cumulative volume delta (CVD) as an on-chart oscillator. It uses intrabar analysis to obtain more precise volume delta information compared to methods that only use the chart's timeframe.
The core concepts in this script come from our first CVD indicator , which displays CVD values as plot candles in a separate indicator pane. In this script, CVD values are scaled according to price ranges and represented on the main chart pane.
█ CONCEPTS
Bar polarity
Bar polarity refers to the position of the close price relative to the open price. In other words, bar polarity is the direction of price change.
Intrabars
Intrabars are chart bars at a lower timeframe than the chart's. Each 1H chart bar of a 24x7 market will, for example, usually contain 60 bars at the lower timeframe of 1min, provided there was market activity during each minute of the hour. Mining information from intrabars can be useful in that it offers traders visibility on the activity inside a chart bar.
Lower timeframes (LTFs)
A lower timeframe is a timeframe that is smaller than the chart's timeframe. This script utilizes a LTF to analyze intrabars, or price changes within a chart bar. The lower the LTF, the more intrabars are analyzed, but the less chart bars can display information due to the limited number of intrabars that can be analyzed.
Volume delta
Volume delta is a measure that separates volume into "up" and "down" parts, then takes the difference to estimate the net demand for the asset. This approach gives traders a more detailed insight when analyzing volume and market sentiment. There are several methods for determining whether an asset's volume belongs in the "up" or "down" category. Some indicators, such as On Balance Volume and the Klinger Oscillator , use the change in price between bars to assign volume values to the appropriate category. Others, such as Chaikin Money Flow , make assumptions based on open, high, low, and close prices. The most accurate method involves using tick data to determine whether each transaction occurred at the bid or ask price and assigning the volume value to the appropriate category accordingly. However, this method requires a large amount of data on historical bars, which can limit the historical depth of charts and the number of symbols for which tick data is available.
In the context where historical tick data is not yet available on TradingView, intrabar analysis is the most precise technique to calculate volume delta on historical bars on our charts. This indicator uses intrabar analysis to achieve a compromise between simplicity and accuracy in calculating volume delta on historical bars. Our Volume Profile indicators use it as well. Other volume delta indicators in our Community Scripts , such as the Realtime 5D Profile , use real-time chart updates to achieve more precise volume delta calculations. However, these indicators aren't suitable for analyzing historical bars since they only work for real-time analysis.
This is the logic we use to assign intrabar volume to the "up" or "down" category:
• If the intrabar's open and close values are different, their relative position is used.
• If the intrabar's open and close values are the same, the difference between the intrabar's close and the previous intrabar's close is used.
• As a last resort, when there is no movement during an intrabar and it closes at the same price as the previous intrabar, the last known polarity is used.
Once all intrabars comprising a chart bar are analyzed, we calculate the net difference between "up" and "down" intrabar volume to produce the volume delta for the chart bar.
█ FEATURES
CVD resets
The "cumulative" part of the indicator's name stems from the fact that calculations accumulate during a period of time. By periodically resetting the volume delta accumulation, we can analyze the progression of volume delta across manageable chunks, which is often more useful than looking at volume delta accumulated from the beginning of a chart's history.
You can configure the reset period using the "CVD Resets" input, which offers the following selections:
• None : Calculations do not reset.
• On a fixed higher timeframe : Calculations reset on the higher timeframe you select in the "Fixed higher timeframe" field.
• At a fixed time that you specify.
• At the beginning of the regular session .
• On trend changes : Calculations reset on the direction change of either the Aroon indicator, Parabolic SAR , or Supertrend .
• On a stepped higher timeframe : Calculations reset on a higher timeframe automatically stepped using the chart's timeframe and following these rules:
Chart TF HTF
< 1min 1H
< 3H 1D
<= 12H 1W
< 1W 1M
>= 1W 1Y
Specifying intrabar precision
Ten options are included in the script to control the number of intrabars used per chart bar for calculations. The greater the number of intrabars per chart bar, the fewer chart bars can be analyzed.
The first five options allow users to specify the approximate amount of chart bars to be covered:
• Least Precise (Most chart bars) : Covers all chart bars by dividing the current timeframe by four.
This ensures the highest level of intrabar precision while achieving complete coverage for the dataset.
• Less Precise (Some chart bars) & More Precise (Less chart bars) : These options calculate a stepped LTF in relation to the current chart's timeframe.
• Very precise (2min intrabars) : Uses the second highest quantity of intrabars possible with the 2min LTF.
• Most precise (1min intrabars) : Uses the maximum quantity of intrabars possible with the 1min LTF.
The stepped lower timeframe for "Less Precise" and "More Precise" options is calculated from the current chart's timeframe as follows:
Chart Timeframe Lower Timeframe
Less Precise More Precise
< 1hr 1min 1min
< 1D 15min 1min
< 1W 2hr 30min
> 1W 1D 60min
The last five options allow users to specify an approximate fixed number of intrabars to analyze per chart bar. The available choices are 12, 24, 50, 100, and 250. The script will calculate the LTF which most closely approximates the specified number of intrabars per chart bar. Keep in mind that due to factors such as the length of a ticker's sessions and rounding of the LTF, it is not always possible to produce the exact number specified. However, the script will do its best to get as close to the value as possible.
As there is a limit to the number of intrabars that can be analyzed by a script, a tradeoff occurs between the number of intrabars analyzed per chart bar and the chart bars for which calculations are possible.
Display
This script displays raw or cumulative volume delta values on the chart as either line or histogram oscillator zones scaled according to the price chart, allowing traders to visualize volume activity on each bar or cumulatively over time. The indicator's background shows where CVD resets occur, demarcating the beginning of new zones. The vertical axis of each oscillator zone is scaled relative to the one with the highest price range, and the oscillator values are scaled relative to the highest volume delta. A vertical offset is applied to each oscillator zone so that the highest oscillator value aligns with the lowest price. This method ensures an accurate, intuitive visual comparison of volume activity within zones, as the scale is consistent across the chart, and oscillator values sit below prices. The vertical scale of oscillator zones can be adjusted using the "Zone Height" input in the script settings.
This script displays labels at the highest and lowest oscillator values in each zone, which can be enabled using the "Hi/Lo Labels" input in the "Visuals" section of the script settings. Additionally, the oscillator's value on a chart bar is displayed as a tooltip when a user hovers over the bar, which can be enabled using the "Value Tooltips" input.
Divergences occur when the polarity of volume delta does not match that of the chart bar. The script displays divergences as bar colors and background colors that can be enabled using the "Color bars on divergences" and "Color background on divergences" inputs.
An information box in the lower-left corner of the indicator displays the HTF used for resets, the LTF used for intrabars, the average quantity of intrabars per chart bar, and the number of chart bars for which there is LTF data. This is enabled using the "Show information box" input in the "Visuals" section of the script settings.
FOR Pine Script™ CODERS
• This script utilizes `ltf()` and `ltfStats()` from the lower_tf library.
The `ltf()` function determines the appropriate lower timeframe from the selected calculation mode and chart timeframe, and returns it in a format that can be used with request.security_lower_tf() .
The `ltfStats()` function, on the other hand, is used to compute and display statistical information about the lower timeframe in an information box.
• The script utilizes display.data_window and display.status_line to restrict the display of certain plots.
These new built-ins allow coders to fine-tune where a script’s plot values are displayed.
• The newly added session.isfirstbar_regular built-in allows for resetting the CVD segments at the start of the regular session.
• The VisibleChart library developed by our resident PineCoders team leverages the chart.left_visible_bar_time and chart.right_visible_bar_time variables to optimize the performance of this script.
These variables identify the opening time of the leftmost and rightmost visible bars on the chart, allowing the script to recalculate and draw objects only within the range of visible bars as the user scrolls.
This functionality also enables the scaling of the oscillator zones.
These variables are just a couple of the many new built-ins available in the chart.* namespace.
For more information, check out this blog post or look them up by typing "chart." in the Pine Script™ Reference Manual .
• Our ta library has undergone significant updates recently, including the incorporation of the `aroon()` indicator used as a method for resetting CVD segments within this script.
Revisit the library to see more of the newly added content!
Look first. Then leap.

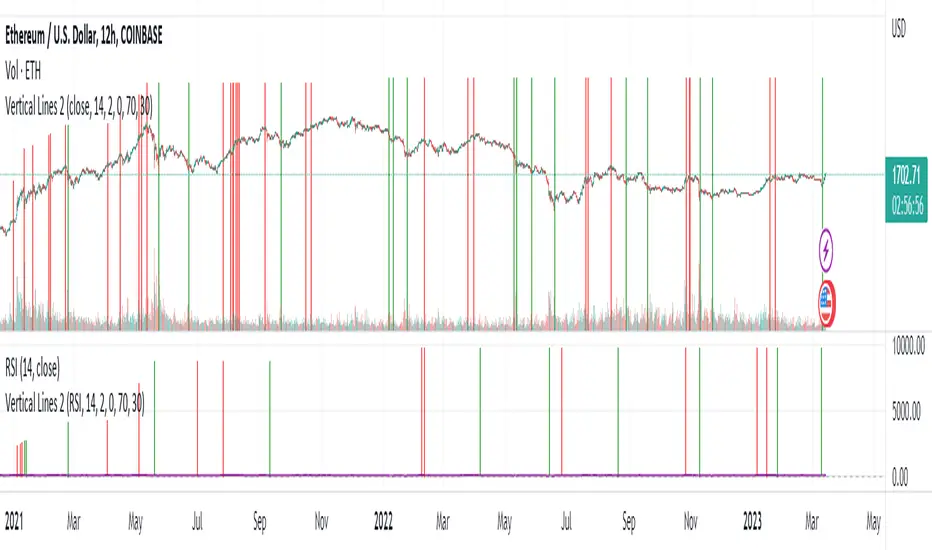
Vertical LinesThis script plots vertical lines on charts or indicators. Unfortunately pinescript is lacking a vertical line plotting function. Vertical lines are useful to mark events, such as crossover of levels, indicators signals or as a time marker.
After searching the internet for a long time and trying different scripts, this script is the simplest and visually the best. You would think that plotting a vertical line would be relatively easy, it is not! I thank the unknow author for sharing this solution and now I will share it on tradingview to make it readily available to anybody that needs it.
RSI crossover signals are used as an example in this script. When the RSI crosses over 70 or below 30, the script plots a red or green vertical line.
The script plots a vertical line as a histogram bar. The histogram bar must have a height.
Setting the height near infinity like 1e20 will cover all the ranges from top to bottom in most charts, but doesn't work all the time. If the chart range is small in values, the line is not plotted or the chart is visually compressed because the top of the bar is also a data point in the chart. Another solution is to find the highest point in the chart and multiply it by a number from 2 to 10 to set the top of the histogram bar. But this solution doesn't work if the line is drawn in the indicator window. additionally if the chart or indicator includes negative values, a histogram bar with a negative height must be concatenated to the histogram bar with a positive height to cover the positive and negative range.
It would seem intuitive to include a vertical plot function since it is very useful and pinescript already has a horizontal line plot function called Hline. But pinescript is becoming less intuitive, and redundant. A case in point is Version 4 variable declaration and naming, it less intuitive and more redundant than previous versions. I beg Tradingview to adopt a more refined scripting language such as Matlab or Python for charting purposes. These languages can be easily ported to other analysis programs for AI or statistical analysis.
Realtime Delta Volume Action [LucF]█ OVERVIEW
This indicator displays on-chart, realtime, delta volume and delta ticks information for each bar. It aims to provide traders who trade price action on small timeframes with volume and tick information gathered as updates come in the chart's feed. It builds its own candles, which are optimized to display volume delta information. It only works in realtime.
█ WARNING
This script is intended for traders who can already profitably trade discretionary on small timeframes. The high cost in fees and the excitement of trading at small timeframes have ruined many newcomers to trading. While trading at small timeframes can work magic for adrenaline junkies in search of thrills rather than profits, I DO NOT recommend it to most traders. Only seasoned discretionary traders able to factor in the relatively high cost of such a trading practice can ever hope to take money out of markets in that type of environment, and I would venture they account for an infinitesimal percentage of traders. If you are a newcomer to trading, AVOID THIS TOOL AT ALL COSTS — unless you are interested in experimenting with the interpretation of volume delta combined with price action. No tool currently available on TradingView provides this type of close monitoring of volume delta information, but if you are not already trading small timeframes profitably, please do not let yourself become convinced that it is the missing piece you needed. Avoid becoming a sucker who only contributes by providing liquidity to markets.
The information calculated by the indicator cannot be saved on charts, nor can it be recalculated from historical bars.
If you refresh the chart or restart the script, the accumulated information will be lost.
█ FEATURES
Key values
The script displays the following key values:
• Above the bar: ticks delta (DT), the total ticks for the bar, the percentage of total ticks that DT represents (DT%)
• Below the bar: volume delta (DV), the total volume for the bar, the percentage of total volume that DV represents (DV%).
Candles
Candles are composed of four components:
1. A top shaped like this: ┴, and a bottom shaped like this: ┬ (picture a normal Japanese candle without a body outline; the values used are the same).
2. The candle bodies are filled with the bull/bear color representing the polarity of DV. The intensity of the body's color is determined by the DV% value.
When DV% is 100, the intensity of the fill is brightest. This plays well in interpreting the body colors, as the smaller, less significant DV% values will produce less vivid colors.
3. The bright-colored borders of the candle bodies occur on "strong bars", i.e., bars meeting the criteria selected in the script's inputs, which you can configure.
4. The POC line is a small horizontal line that appears to the left of the candle. It is the volume-weighted average of all price updates during the bar.
Calculations
This script monitors each realtime update of the chart's feed. It first determines if price has moved up or down since the last update. The polarity of the price change, in turn, determines the polarity of the volume and tick for that specific update. If price does not move between consecutive updates, then the last known polarity is used. Using this method, we can calculate a running volume delta and ticks delta for the bar, which becomes the bar's final delta values when the bar closes (you can inspect values of elapsed realtime bars in the Data Window or the indicator's values). Note that these values will all reset if the script re-executes because of a change in inputs or a chart refresh.
While this method of calculating is not perfect, it is by far the most precise way of calculating volume delta available on TradingView at the moment. Calculating more precise results would require scripts to have access to tick data from any chart timeframe. Charts at seconds timeframes do use exchange/broker ticks when the feeds you are using allow for it, and this indicator will run on them, but tick data is not yet available from higher timeframes. Also, note that the method used in this script is far superior to the intrabar inspection technique used on historical bars in my other "Delta Volume" indicators. This is because volume and ticks delta here are calculated from many more realtime updates than the available intrabars in history. Unfortunately, the calculation method used here cannot be used on historical bars, where intrabar inspection remains, in my opinion, the optimal method.
Inputs
The script's inputs provide many ways to personalize all the components: what is displayed, the colors used to display the information, and the marker conditions. Tooltips provide details for many of the inputs; I leave their exploration to you.
Markers
Markers provide a way for you to identify the points of interest of your choice on the chart. You control the set of conditions that trigger each of the five available markers.
You select conditions by entering, in the field for each marker, the number of each condition you want to include, separated by a comma. The conditions are:
1 — The bar's polarity is up/dn.
2 — `close` rises/falls ("rises" means it is higher than its value on the previous bar).
3 — DV's polarity is +/–.
4 — DV% rises (↕).
5 — POC rises/falls.
6 — The quantity of realtime updates rises (↕).
7 — DV > limit (You specify the limit in the inputs. Since DV can be +/–, DV– must be less than `–limit` for a short marker).
8 — DV% > limit (↕).
9 — DV+ rises for a long marker, DV– falls for a short.
10 — Consecutive DV+/DV– on two bars.
11 — Total volume rises (↕).
12 — DT's polarity is +/–.
13 — DT% rises (↕).
14 — DT+ rises for a long marker, DT– falls for a short.
Conditions showing the (↕) symbol do not have symmetrical states; they act more like filters. If you only include condition 4 in a marker's setup, for example, both long and short markers will trigger on bars where DV% rises. To trigger only long or short markers, you must add a condition providing directional differentiation, such as conditions 1 or 2. Accordingly, you would enter "1,4" or "2,4".
For a marker to trigger, ALL the conditions you specified for it must be met. Long markers appear on the chart as "Mx▲" signs under the values displayed below candles. Short markers display "Mx▼" over the number of updates displayed above candles. The marker's number will replace the "x" in "Mx▲". The script loads with five markers that will not trigger because no conditions are associated with them. To activate markers, you will need to select and enter the set of conditions you require for each one.
Alerts
You can configure alerts on this script. They will trigger whenever one of the configured markers triggers. Alerts do not repaint, so they trigger at the bar's close—which is also when the markers will appear.
█ HOW TO USE IT
As a rule, I do not prescribe expected use of my indicators, as traders have proved to be much more creative than me in using them. Additionally, I tend to think that if you expect detailed recommendations from me to be able to use my indicators, it's a sign you are in a precarious situation and should go back to the drawing board and master the necessary basics that will allow you to explore and decide for yourself if my indicators can be useful to you, and how you will use them. I will make an exception for this thing, as it presents fairly novel information. I will use simple logic to surmise potential uses, as contrary to most of my other indicators, I have NOT used this one to actually trade. Markets have a way of throwing wrenches in our seemingly bullet-proof rationalizing, so drive cautiously and please forgive me if the pointers I share here don't pan out.
The first thing to do is to disable your normal bars. You can do this by clicking on the eye icon that appears when you hover over the symbol's name in the upper-left corner of your chart.
The absolute value and polarity of DV mean little without perspective; that's why I include both total volume for the bar and the percentage that DV represents of that total volume. I interpret a low DV% value as indecision. If you share that opinion, you could, let's say, configure one of the markers on "DV% > 80%", for example (to do so you would enter "8" in the condition field of any marker, and "80" in the limit field for condition 8, below the marker conditions).
I also like to analyze price action on the bar with DV%. Small DV% values should often produce small candle bodies. If a small DV% value occurs on a bar with much movement and high volume, I'm thinking "tough battle with potential explosive power when one side wins". Conversely, large bodies with high DV% mean that large volume is breaching through multiple levels, or that nobody is suddenly willing to take the other side of a normal volume of trades.
I find the POC lines really interesting. First, they tell us the price point where the most significant action (taking into account both price occurrences AND volume) during the bar occurred. Second, they can be useful when compared against past values. Third, their color helps us in figuring out which ones are the most significant. Unsurprisingly, bunches of orange POCs tend to appear in consolidation zones, in pauses, and before reversals. It may be useful to often focus more on POC progression than on `close` values. This is not to say that OHLC values are not useful; looking, as is customary, for higher highs or lower lows, or for repeated tests of precise levels can of course still be useful. I do like how POCs add another dimension to chart readings.
What should you do with the ticks delta above bars? Old-time ticker tape readers paid attention to the sounds coming from it (the "ticker" moniker actually comes from the sound they made). They knew activity was picking up when the frequency of the "ticks" increased. My thinking is that the total number of ticks will help you in the same way, since increasing updates usually mean growing interest—and thus perhaps price movement, as increasing volatility or volume would lead us to surmise. Ticks delta can help you figure out when proportionally large, random orders come in from traders with other perspectives than the short-term price action you are typically working with when you use this tool. Just as volume delta, ticks delta are one more informational component that can help you confirm convergence when building your opinions on price action.
What are strong bars? They are an attempt to identify significance. They are like a default marker, except that instead of displaying "Mx▲/▼" below/above the bar, the candle's body is outlined in bright bull/bear color when one is detected. Strong bars require a respectable amount of conditions to be met (you can see and re-configure them in the inputs). Think of them as pushes rather than indications of an upcoming, strong and multi-bar move. Pushes do, for sure, often occur at the beginning of strong trends. You will often see a few strong bars occur at 2-3 bar intervals at the beginning or middle of trends. But they also tend to occur at tops/bottoms, which makes their interpretation problematic. Another pattern that you will see quite frequently is a final strong bar in the direction of the trend, followed a few bars later by another strong bar in the reverse direction. My summary analyses seemed to indicate these were perhaps good points where one could make a bet on an early, risky reversal entry.
The last piece of information displayed by the indicator is the color of the candle bodies. Three possible colors are used. Bull/bear is determined by the polarity of DV, but only when the bar's polarity matches that of DV. When it doesn't, the color is the divergence color (orange, by default). Whichever color is used for the body, its intensity is determined by the DV% value. Maximum intensity occurs when DV%=100, so the more significant DV% values generate more noticeable colors. Body colors can be useful when looking to confirm the convergence of other components. The visual effect this creates hopefully makes it easier to detect patterns on the chart.
One obvious methodology that comes to mind to trade with this tool would be to use another indicator like Technical Ratings at a higher timeframe to identify the larger context's trend, and then use this tool to identify entries for short-term trades in that direction.
█ NOTES AND RAMBLINGS
Instant Calculations
This indicator uses instant values calculated on the bar only. No moving averages or calculations involving historical periods are used. The only exception to this rule is in some of the marker conditions like "Two consecutive DV+ values", where information from the previous bar is used.
Trading Small vs Long Timeframes
I never trade discretionary at the 5sec–5min timeframes this indicator was designed to be used with; I trade discretionary at 1D, 1W and 1M timeframes, and let systems trade at smaller timeframes. The higher the timeframe you trade at, the fewer fees you will pay because you trade less and are not churning trading volume, as is inevitable at smaller timeframes. Trading at higher timeframes is also a good way to gain an instant edge on most of the trading crowd that has its nose to the ground and often tends to forget the big picture. It also makes for a much less demanding trading practice, where you have lots of time to research and build your long-term opinions on potential future outcomes. While the future is always uncertain, I believe trades riding on long-term trends have stronger underlying support from the reality outside markets.
To traders who will ask why I publish an indicator designed for small timeframes, let me say that my main purpose here is to showcase what can be done with Pine. I often see comments by coders who are obviously not aware of what Pine is capable of in 2021. Since its humble beginnings seven years ago, Pine has grown and become a serious programming language. TradingView's growing popularity and its ongoing commitment to keep Pine accessible to newcomers to programming is gradually making Pine more and more of a standard in indicator and strategy programming. The technical barriers to entry for traders interested in owning their trading practice by developing their personal tools to trade have never been so low. I am also publishing this script because I value volume delta information, and I present here what I think is an original way of analyzing it.
Performance
The script puts a heavy load on the Pine runtime and the charting engine. After running the script for a while, you will often notice your chart becoming less responsive, and your chart tab can take longer to activate when you go back to it after using other tabs. That is the reason I encourage you to set the number of historical values displayed on bars to the minimum that meets your needs. When your chart becomes less responsive because the script has been running on it for many hours, refreshing the browser tab will restart everything and bring the chart's speed back up. You will then lose the information displayed on elapsed bars.
Neutral Volume
This script represents a departure from the way I have previously calculated volume delta in my scripts. I used the notion of "neutral volume" when inspecting intrabar timeframes, for bars where price did not move. No longer. While this had little impact when using intrabar inspection because the minimum usable timeframe was 1min (where bars with zero movement are relatively infrequent), a more precise way was required to handle realtime updates, where multiple consecutive prices often have the same value. This will usually happen whenever orders are unable to move across the bid/ask levels, either because of slow action or because a large-volume bid/ask level is taking time to breach. In either case, the proper way to calculate the polarity of volume delta for those updates is to use the last known polarity, which is how I calculate now.
The Order Book
Without access to the order book's levels (the depth of market), we are limited to analyzing transactions that come in the TradingView feed for the chart. That does not mean the volume delta information calculated this way is irrelevant; on the contrary, much of the information calculated here is not available in trading consoles supplied by exchanges/brokers. Yet it's important to realize that without access to the order book, you are forfeiting the valuable information that can be gleaned from it. The order book's levels are always in movement, of course, and some of the information they contain is mere posturing, i.e., attempts to influence the behavior of other players in the market by traders/systems who will often remove their orders when price comes near their order levels. Nonetheless, the order book is an essential tool for serious traders operating at intraday timeframes. It can be used to time entries/exits, to explain the causes of particular price movements, to determine optimal stop levels, to get to know the traders/systems you are betting against (they tend to exhibit behavioral patterns only recognizable through the order book), etc. This tool in no way makes the order book less useful; I encourage all intraday traders to become familiar with it and avoid trading without one.

Delta Volume Columns Pro [LucF]█ OVERVIEW
This indicator displays volume delta information calculated with intrabar inspection on historical bars, and feed updates when running in realtime. It is designed to run in a pane and can display either stacked buy/sell volume columns or a signal line which can be calculated and displayed in many different ways.
Five different models are offered to reveal different characteristics of the calculated volume delta information. Many options are offered to visualize the calculations, giving you much leeway in morphing the indicator's visuals to suit your needs. If you value delta volume information, I hope you will find the time required to master Delta Volume Columns Pro well worth the investment. I am confident that if you combine a proper understanding of the indicator's information with an intimate knowledge of the volume idiosyncrasies on the markets you trade, you can extract useful market intelligence using this tool.
█ WARNINGS
1. The indicator only works on markets where volume information is available,
Please validate that your symbol's feed carries volume information before asking me why the indicator doesn't plot values.
2. When you refresh your chart or re-execute the script on the chart, the indicator will repaint because elapsed realtime bars will then recalculate as historical bars.
3. Because the indicator uses different modes of calculation on historical and realtime bars, it's critical that you understand the differences between them. Details are provided further down.
4. Calculations using intrabar inspection on historical bars can only be done from some chart timeframes. See further down for a list of supported timeframes.
If the chart's timeframe is not supported, no historical volume delta will display.
█ CONCEPTS
Chart bars
Three different types of bars are used in charts:
1. Historical bars are bars that have already closed when the script executes on them.
2. The realtime bar is the current, incomplete bar where a script is running on an open market. There is only one active realtime bar on your chart at any given time.
The realtime bar is where alerts trigger.
3. Elapsed realtime bars are bars that were calculated when they were realtime bars but have since closed.
When a script re-executes on a chart because the browser tab is refreshed or some of its inputs are changed, elapsed realtime bars are recalculated as historical bars.
Why does this indicator use two modes of calculation?
Historical bars on TradingView charts contain OHLCV data only, which is insufficient to calculate volume delta on them with any level of precision. To mine more detailed information from those bars we look at intrabars , i.e., bars from a smaller timeframe (we call it the intrabar timeframe ) that are contained in one chart bar. If your chart Is running at 1D on a 24x7 market for example, most 1D chart bars will contain 24 underlying 1H bars in their dilation. On historical bars, this indicator looks at those intrabars to amass volume delta information. If the intrabar is up, its volume goes in the Buy bin, and inversely for the Sell bin. When price does not move on an intrabar, the polarity of the last known movement is used to determine in which bin its volume goes.
In realtime, we have access to price and volume change for each update of the chart. Because a 1D chart bar can be updated tens of thousands of times during the day, volume delta calculations on those updates is much more precise. This precision, however, comes at a price:
— The script must be running on the chart for it to keep calculating in realtime.
— If you refresh your chart you will lose all accumulated realtime calculations on elapsed realtime bars, and the realtime bar.
Elapsed realtime bars will recalculate as historical bars, i.e., using intrabar inspection, and the realtime bar's calculations will reset.
When the script recalculates elapsed realtime bars as historical bars, the values on those bars will change, which means the script repaints in those conditions.
— When the indicator first calculates on a chart containing an incomplete realtime bar, it will count ALL the existing volume on the bar as Buy or Sell volume,
depending on the polarity of the bar at that point. This will skew calculations for that first bar. Scripts have no access to the history of a realtime bar's previous updates,
and intrabar inspection cannot be used on realtime bars, so this is the only to go about this.
— Even if alerts only trigger upon confirmation of their conditions after the realtime bar closes, they are repainting alerts
because they would perhaps not have calculated the same way using intrabar inspection.
— On markets like stocks that often have different EOD and intraday feeds and volume information,
the volume's scale may not be the same for the realtime bar if your chart is at 1D, for example,
and the indicator is using an intraday timeframe to calculate on historical bars.
— Any chart timeframe can be used in realtime mode, but plots that include moving averages in their calculations may require many elapsed realtime bars before they can calculate.
You might prefer drastically reducing the periods of the moving averages, or using the volume columns mode, which displays instant values, instead of the line.
Volume Delta Balances
This indicator uses a variety of methods to evaluate five volume delta balances and derive other values from those balances. The five balances are:
1 — On Bar Balance : This is the only balance using instant values; it is simply the subtraction of the Sell volume from the Buy volume on the bar.
2 — Average Balance : Calculates a distinct EMA for both the Buy and Sell volumes, and subtracts the Sell EMA from the Buy EMA.
3 — Momentum Balance : Starts by calculating, separately for both Buy and Sell volumes, the difference between the same EMAs used in "Average Balance" and
an SMA of double the period used for the "Average Balance" EMAs. The difference for the Sell side is subtracted from the difference for the Buy side,
and an RSI of that value is calculated and brought over the −50/+50 scale.
4 — Relative Balance : The reference values used in the calculation are the Buy and Sell EMAs used in the "Average Balance".
From those, we calculate two intermediate values using how much the instant Buy and Sell volumes on the bar exceed their respective EMA — but with a twist.
If the bar's Buy volume does not exceed the EMA of Buy volume, a zero value is used. The same goes for the Sell volume with the EMA of Sell volume.
Once we have our two intermediate values for the Buy and Sell volumes exceeding their respective MA, we subtract them. The final "Relative Balance" value is an ALMA of that subtraction.
The rationale behind using zero values when the bar's Buy/Sell volume does not exceed its EMA is to only take into account the more significant volume.
If both instant volume values exceed their MA, then the difference between the two is the signal's value.
The signal is called "relative" because the intermediate values are the difference between the instant Buy/Sell volumes and their respective MA.
This balance flatlines when the bar's Buy/Sell volumes do not exceed their EMAs, which makes it useful to spot areas where trader interest dwindles, such as consolidations.
The smaller the period of the final value's ALMA, the more easily you will see the balance flatline. These flat zones should be considered no-trade zones.
5 — Percent Balance : This balance is the ALMA of the ratio of the "On Bar Balance" value, i.e., the volume delta balance on the bar (which can be positive or negative),
over the total volume for that bar.
From the balances and marker conditions, two more values are calculated:
1 — Marker Bias : It sums the up/down (+1/‒1) occurrences of the markers 1 to 4 over a period you define, so it ranges from −4 to +4, times the period.
Its calculation will depend on the modes used to calculate markers 3 and 4.
2 — Combined Balances : This is the sum of the bull/bear (+1/−1) states of each of the five balances, so it ranges from −5 to +5.
█ FEATURES
The indicator has two main modes of operation: Columns and Line .
Columns
• In Columns mode you can display stacked Buy/Sell volume columns.
• The buy section always appears above the centerline, the sell section below.
• The top and bottom sections can be colored independently using eight different methods.
• The EMAs of the Buy/Sell values can be displayed (these are the same EMAs used to calculate the "Average Balance").
Line
• Displays one of seven signals: the five balances or one of two complementary values, i.e., the "Marker Bias" or the "Combined Balances".
• You can color the line and its fill using independent calculation modes to pack more information in the display.
You can thus appraise the state of 3 different values using the line itself, its color and the color of its fill.
• A "Divergence Levels" feature will use the line to automatically draw expanding levels on divergence events.
Default settings
Using the indicator's default settings, this is the information displayed:
• The line is calculated on the "Average Balance".
• The line's color is determined by the bull/bear state of the "Percent Balance".
• The line's fill gradient is determined by the advances/declines of the "Momentum Balance".
• The orange divergence dots are calculated using discrepancies between the polarity of the "On Bar Balance" and the chart's bar.
• The divergence levels are determined using the line's level when a divergence occurs.
• The background's fill gradient is calculated on advances/declines of the "Marker Bias".
• The chart bars are colored using advances/declines of the "Relative Balance". Divergences are shown in orange.
• The intrabar timeframe is automatically determined from the chart's timeframe so that a minimum of 50 intrabars are used to calculate volume delta on historical bars.
Alerts
The configuration of the marker conditions explained further is what determines the conditions that will trigger alerts created from this script. Note that simply selecting the display of markers does not create alerts. To create an alert on this script, you must use ALT-A from the chart. You can create multiple alerts triggering on different conditions from this same script; simply configure the markers so they define the trigger conditions for each alert before creating the alert. The configuration of the script's inputs is saved with the alert, so from then on you can change them without affecting the alert. Alert messages will mention the marker(s) that triggered the specific alert event. Keep in mind, when creating alerts on small chart timeframes, that discrepancies between alert triggers and markers displayed on your chart are to be expected. This is because the alert and your chart are running two distinct instances of the indicator on different servers and different feeds. Also keep in mind that while alerts only trigger on confirmed conditions, they are calculated using realtime calculation mode, which entails that if you refresh your chart and elapsed realtime bars recalculate as historical bars using intrabar inspection, markers will not appear in the same places they appeared in realtime. So it's important to understand that even though the alert conditions are confirmed when they trigger, these alerts will repaint.
Let's go through the sections of the script's inputs.
Columns
The size of the Buy/Sell columns always represents their respective importance on the bar, but the coloring mode for tops and bottoms is independent. The default setup uses a standard coloring mode where the Buy/Sell columns are always in the bull/bear color with a higher intensity for the winning side. Seven other coloring modes allow you to pack more information in the columns. When choosing to color the top columns using a bull/bear gradient on "Average Balance", for example, you will have bull/bear colored tops. In order for the color of the bottom columns to continue to show the instant bar balance, you can then choose the "On Bar Balance — Dual Solid Colors" coloring mode to make those bars the color of the winning side for that bar. You can display the averages of the Buy and Sell columns. If you do, its coloring is controlled through the "Line" and "Line fill" sections below.
Line and Line fill
You can select the calculation mode and the thickness of the line, and independent calculations to determine the line's color and fill.
Zero Line
The zero line can display dots when all five balances are bull/bear.
Divergences
You first select the detection mode. Divergences occur whenever the up/down direction of the signal does not match the up/down polarity of the bar. Divergences are used in three components of the indicator's visuals: the orange dot, colored chart bars, and to calculate the divergence levels on the line. The divergence levels are dynamic levels that automatically build from the line's values on divergence events. On consecutive divergences, the levels will expand, creating a channel. This implementation of the divergence levels corresponds to my view that divergences indicate anomalies, hesitations, points of uncertainty if you will. It precludes any attempt to identify a directional bias to divergences. Accordingly, the levels merely take note of divergence events and mark those points in time with levels. Traders then have a reference point from which they can evaluate further movement. The bull/bear/neutral colors used to plot the levels are also congruent with this view in that they are determined by the line's position relative to the levels, which is how I think divergences can be put to the most effective use. One of the coloring modes for the line's fill uses advances/declines in the line after divergence events.
Background
The background can show a bull/bear gradient on six different calculations. As with other gradients, you can adjust its brightness to make its importance proportional to how you use it in your analysis.
Chart bars
Chart bars can be colored using seven different methods. You have the option of emptying the body of bars where volume does not increase, as does my TLD indicator, and you can choose whether you want to show divergences.
Intrabar Timeframe
This is the intrabar timeframe that will be used to calculate volume delta using intrabar inspection on historical bars. You can choose between four modes. The three "Auto-steps" modes calculate, from the chart's timeframe, the intrabar timeframe where the said number of intrabars will make up the dilation of chart bars. Adjustments are made for non-24x7 markets. "Fixed" mode allows you to select the intrabar timeframe you want. Checking the "Show TF" box will display in the lower-right corner the intrabar timeframe used at any given moment. The proper selection of the intrabar timeframe is important. It must achieve maximal granularity to produce precise results while not unduly slowing down calculations, or worse, causing runtime errors. Note that historical depth will vary with the intrabar timeframe. The smaller the timeframe, the shallower historical plots you will be.
Markers
Markers appear when the required condition has been confirmed on a closed bar. The configuration of the markers when you create an alert is what determines when the alert will trigger. Five markers are available:
• Balances Agreement : All five balances are either bullish or bearish.
• Double Bumps : A double bump is two consecutive up/down bars with +/‒ volume delta, and rising Buy/Sell volume above its average.
• Divergence confirmations : A divergence is confirmed up/down when the chosen balance is up/down on the previous bar when that bar was down/up, and this bar is up/down.
• Balance Shifts : These are bull/bear transitions of the selected signal.
• Marker Bias Shifts : Marker bias shifts occur when it crosses into bull/bear territory.
Periods
Allows control over the periods of the different moving averages used to calculate the balances.
Volume Discrepancies
Stock exchanges do not report the same volume for intraday and daily (or higher) resolutions. Other variations in how volume information is reported can also occur in other markets, namely Forex, where volume irregularities can even occur between different intraday timeframes. This will cause discrepancies between the total volume on the bar at the chart's timeframe, and the total volume calculated by adding the volume of the intrabars in that bar's dilation. This does not necessarily invalidate the volume delta information calculated from intrabars, but it tells us that we are using partial volume data. A mechanism to detect chart vs intrabar timeframe volume discrepancies is provided. It allows you to define a threshold percentage above which the background will indicate a difference has been detected.
Other Settings
You can control here the display of the gray dot reminder on realtime bars, and the display of error messages if you are using a chart timeframe that is not greater than the fixed intrabar timeframe, when you use that mode. Disabling the message can be useful if you only use realtime mode at chart timeframes that do not support intrabar inspection.
█ RAMBLINGS
On Volume Delta
Volume is arguably the best complement to interpret price action, and I consider volume delta to be the most effective way of processing volume information. In periods of low-volatility price consolidations, volume will typically also be lower than normal, but slight imbalances in the trend of the buy/sell volume balance can sometimes help put early odds on the direction of the break from consolidation. Additionally, the progression of the volume imbalance can help determine the proximity of the breakout. I also find volume delta and the number of divergences very useful to evaluate the strength of trends. In trends, I am looking for "slow and steady", i.e., relatively low volatility and pauses where price action doesn't look like world affairs are being reassessed. In my personal mythology, this type of trend is often more resilient than high-volatility breakouts, especially when volume balance confirms the general agreement of traders signaled by the low-volatility usually accompanying this type of trend. The volume action on pauses will often help me decide between aggressively taking profits, tightening a stop or going for a longer-term movement. As for reversals, they generally occur in high-volatility areas where entering trades is more expensive and riskier. While the identification of counter-trend reversals fascinates many traders to no end, they represent poor opportunities in my view. Volume imbalances often precede reversals, but I prefer to use volume delta information to identify the areas following reversals where I can confirm them and make relatively low-cost entries with better odds.
On "Buy/Sell" Volume
Buying or selling volume are misnomers, as every unit of volume transacted is both bought and sold by two different traders. While this does not keep me from using the terms, there is no such thing as “buy only” or “sell only” volume. Trader lingo is riddled with peculiarities.
Divergences
The divergence detection method used here relies on a difference between the direction of a signal and the polarity (up/down) of a chart bar. When using the default "On Bar Balance" to detect divergences, however, only the bar's volume delta is used. You may wonder how there can be divergences between buying/selling volume information and price movement on one bar. This will sometimes be due to the calculation's shortcomings, but divergences may also occur in instances where because of order book structure, it takes less volume to increase the price of an asset than it takes to decrease it. As usual, divergences are points of interest because they reveal imbalances, which may or may not become turning points. To your pattern-hungry brain, the divergences displayed by this indicator will — as they do on other indicators — appear to often indicate turnarounds. My opinion is that reality is generally quite sobering and I have no reliable information that would tend to prove otherwise. Exercise caution when using them. Consequently, I do not share the overwhelming enthusiasm of traders in identifying bullish/bearish divergences. For me, the best course of action when a divergence occurs is to wait and see what happens from there. That is the rationale underlying how my divergence levels work; they take note of a signal's level when a divergence occurs, and it's the signal's behavior from that point on that determines if the post-divergence action is bullish/bearish.
Superfluity
In "The Bed of Procrustes", Nassim Nicholas Taleb writes: To bankrupt a fool, give him information . This indicator can display lots of information. While learning to use a new indicator inevitably requires an adaptation period where we put it through its paces and try out all its options, once you have become used to it and decide to adopt it, rigorously eliminate the components you don't use and configure the remaining ones so their visual prominence reflects their relative importance in your analysis. I tried to provide flexible options for traders to control this indicator's visuals for that exact reason — not for window dressing.
█ LIMITATIONS
• This script uses a special characteristic of the `security()` function allowing the inspection of intrabars — which is not officially supported by TradingView.
It has the advantage of permitting a more robust calculation of volume delta than other methods on historical bars, but also has its limits.
• Intrabar inspection only works on some chart timeframes: 3, 5, 10, 15 and 30 minutes, 1, 2, 3, 4, 6, and 12 hours, 1 day, 1 week and 1 month.
The script’s code can be modified to run on other resolutions.
• When the difference between the chart’s timeframe and the intrabar timeframe is too great, runtime errors will occur. The Auto-Steps selection mechanisms should avoid this.
• All volume is not created equally. Its source, components, quality and reliability will vary considerably with sectors and instruments.
The higher the quality, the more reliably volume delta information can be used to guide your decisions.
You should make it your responsibility to understand the volume information provided in the data feeds you use. It will help you make the most of volume delta.
█ NOTES
For traders
• The Data Window shows key values for the indicator.
• While this indicator displays some of the same information calculated in my Delta Volume Columns ,
I have elected to make it a separate publication so that traders continue to have a simpler alternative available to them. Both code bases will continue to evolve separately.
• All gradients used in this indicator determine their brightness intensities using advances/declines in the signal—not their relative position in a pre-determined scale.
• Volume delta being relative, by nature, it is particularly well-suited to Forex markets, as it filters out quite elegantly the cyclical volume data characterizing the sector.
If you are interested in volume delta, consider having a look at my other "Delta Volume" indicators:
• Delta Volume Realtime Action displays realtime volume delta and tick information on the chart.
• Delta Volume Candles builds volume delta candles on the chart.
• Delta Volume Columns is a simpler version of this indicator.
For coders
• I use the `f_c_gradientRelativePro()` from the PineCoders Color Gradient Framework to build my gradients.
This function has the advantage of allowing begin/end colors for both the bull and bear colors. It also allows us to define the number of steps allowed for each gradient.
I use this to modulate the gradients so they perform optimally on the combination of the signal used to calculate advances/declines,
but also the nature of the visual component the gradient applies to. I use fewer steps for choppy signals and when the gradient is used on discrete visual components
such as volume columns or chart bars.
• I use the PineCoders Coding Conventions for Pine to write my scripts.
• I used functions modified from the PineCoders MTF Selection Framework for the selection of timeframes.
█ THANKS TO:
— The devs from TradingView's Pine and other teams, and the PineCoders who collaborate with them. They are doing amazing work,
and much of what this indicator does could not be done without their recent improvements to Pine.
— A guy called Kuan who commented on a Backtest Rookies presentation of their Volume Profile indicator using a `for` loop.
This indicator started from the intrabar inspection technique illustrated in Kuan's snippet.
— theheirophant , my partner in the exploration of the sometimes weird abysses of `security()`’s behavior at intrabar timeframes.
— midtownsk8rguy , my brilliant companion in mining the depths of Pine graphics.

Session Bar/Candle ColoringChange the color of candles within a user-defined trading session. Borders and wicks can be changed as well, not just the body color.
PREFACE
This script can be used an educational resource for those who are interested in learning Pine Script. Therefore, the script is published open source and is organized in a manner that follows the recommended Style Guide .
While the main premise of the indicator is rather simple, the script showcases various things that can be achieved such as conditional plotting, alignment of indicator settings, user input validation, script optimization, and more. The script also has examples of taking into consideration the chart timeframe and/or different chart types (Heikin Ashi, Renko, etc.) that a user might be running it on. Note: for complete beginners, I strongly suggest going through the Pine Script User Manual (possibly more than once).
FEATURES
Besides being able to select a specific time window, the indicator also provides additional color settings for changing the background color or changing the colors of neutral/indecisive candles, as shown in the image below.
This allows for a higher level of customization beyond the TradingView chart settings or other similar scripts that are currently available.
HOW TO USE
First, define the intraday trading session that will contain the candles to modify. The session can be limited to specific days of the week.
Next, select the parts of the candles that should be modified: Body, Borders, Wick, and/or Background.
For each of the candle parts that were enabled, you can select the colors that will be used depending on whether a candle is bullish (⇧), bearish (⇩), or neutral (⇆).
All other indicator settings will have a detailed tooltip to describe its usage and/or effect.
LIMITATIONS
The indicator is not intended to function on Daily or higher timeframes due to the intraday nature of session time windows.
The indicator cannot always automatically detect the chart type being used, therefore the user is requested to manually input the chart type via the " Chart Style " setting.
Depending on the available historical data and the selected choice for the " Portion of bar in session " setting, the indicator may not be able to update very old candles on the chart.
EXAMPLE USAGE
This section will show examples of different scenarios that the indicator can be used for.
Emphasizing a main trading session.
Defining a "Pre/post market hours background" like is available for some symbols (e.g., NASDAQ:AAPL ).
Highlighting in which bar the midnight candle occurs.
Hiding indecision bars (neutral candles).
Showing only "Regular Trading Hours" for a chart that does not have the option to toggle ETH/RTH. To achieve this, the actual chart data is hidden, and only the indicator is visible; alternatively, a 2nd instance of the indicator could change colors to match the chart background.
Using a combination of Bars and Japanese Candlesticks. Alternatively, this could be done by hiding the main chart data and using 2 instances of the indicator (one with " Chart Style " setting as Bars , and the other set to Candles ).
Using a combination of thin and thick bars on Range charts. Note: requires disabling the "Thin Bars" setting for Bar charts in the TradingView chart settings.
NOTES
If using more than one instance of this indicator on the same chart, you can use the TradingView "Save Indicator Template" feature to avoid having to re-configure the multiple indicators at a later time.
This indicator is intended to work "out-of-the-box" thanks to the behind_chart option introduced to Pine Script in October 2024. But you can always manually bring the indicator to the front just in case the color changes are not being seen (using the "More" option in the indicator status line: More > Visual Order > Bring to front ).
Many thanks to fikira for their help and inspiring me to create open source scripts.
Any feedback including bug reports or suggestions for improving the indicator (or source code itself) are always welcome in the comments section.

MTFT Patterns Noob, TheStrat Suite (1of5)Multi Time Frame Tools
Multi Time Frame Tools (MTFT) is a suite of scripts aimed to establish a standard timeframe-based color scheme. This can be utilized to overlay different timeframes calculations/values over a single timeframe. As one example, this would allow to observe the 5-month moving average, 5-week moving average, and 5-day moving average overlaid over each other. This would allow to study a chart, get accustomed to the color scheme and study all these at the same time much easier.
All indicators calculated using the below specific timeframes as input, will always use the color scheme outlined below. This is to get you in habit of recognizing the different timeframes overlaid in top of each other. These can be personalized.
Longer TF analysis.
Yearly - Black
Semi-Annual - Yellow
Quarterly - White
Monthly - Maroon
Weekly - Royal Blue
Daily - Lime
Shorter TF analysis.
4 hour - Fuchsia
1 hour - Orange
30 min - Red
15 min - Brown
10 min - Purple
5 min - Lilac
All color coordination is able to be modified in either the “Inputs” or “Style” section. If you need to make changes, make sure to select “Save as Default” on the bottom right of the settings menu.
Recommended Chart Color Layout
I played around with color coordination a lot. The final product was what worked best for me. I personally use the following chart settings to accent all available TF colors.
-> Click on the settings wheel on your chart. -> Click on “Appearance”.
Background - Solid -> On the top row pick the 6th color from the left.
Vert Grid Lines and Horz Grid Lines -> On the top row pick the 7th color from the left.
You may of course change these and the indicator line colors as you like.
Adding indicator to Chart
-> Open the TradingView “Indicators & Strategies” library, the icon has “ƒx”. -> All premium scripts will be located under “Invite-Only Scripts” -> Click indicator to add to your chart.
MTFT TheStrat Suite (5 Scripts)
Rob Smith is the creator of ‘TheStrat’ trading strategy. For ‘TheStrat’ I have put together a suite of 5 premium scripts that combined will offer people interested in learning ‘TheStrat’ a cleaner learning process. For 2 of the 5 scripts specifically, the MTFT approach of overlaying multiple longer timeframes(TF) over a shorter TF selected as a display cannot be utilized. The other 2 scripts will have full MTFT functionality and they are my personal favorite. I will be providing very basic info to utilize this script; it is up to you to dive deep into learning this strategy. I am not an expert with the tool or a financial advisor. As with all aspects of life, I recommend you research, learn, discern and practice extensively in order to become a master.
*1. MTFT Patterns Pro/Noob
2. MTFT Full Time Frame Continuity Table
3. MTFT Last HML wOpen
4. MTFT Actionable Signal Targets
5. MTFT Reversal Lines
MTFT Patterns Pro/Noob, TheStrat Suite (1of5)
Features includes:
1.) Absolute Truth #. This setting will provide the candlesticks absolute truth # below the CS.
2.) Color bars based on Absolute Truth. This setting will color all inside candlesticks yellow, all Green Outside Candlesticks White and all Red Outside Candlesticks Fuchsia. Scenario 2 candlesticks are left as is and will color based on the color of the original candlestick. This setting is default enabled and needs to be disabled in the “Style” tab under the indicator settings wheel. I found this more practical in getting used to the 3 absolute truth scenarios.
3.) Reversals. This setting will mark when reversal patterns as discussed by Rob are posted. Noob version will also include the description of the reversal pattern, while the Pro version will only plot an ‘R’ without the text description. Note: There should never be back-to-back green Rs or red Rs. I found this issue a lot on many of the other ‘TheStrat’ scripts out there. TradingView development team note: The plotchar function does not allow dynamic text so this is the only reason on why there needs to be two separate versions of the script. ‘Pro’ is important for experienced users that already identify the patterns without the text and ‘Noob’ is important for beginner users that still need the text description of the pattern.
4. Continuations. This setting will mark when continuation patterns as discussed by Rob are posted. Noob version will also include the description of the continuation pattern, while the Pro version will only plot a ‘C’ without the text description.
TradingView Admin note: The plotchar function does not allow dynamic text so this is the only reason why there needs to be two separate versions of the script. ‘Pro’ is important for experienced users that already identify the patterns without the text and ‘Noob’ is important for beginner users that still need the text description of the pattern.
5. Actionable Signals and Complex Actionable Signals (CAS). This has several objective parameters as defined by Rob’s course. ‘Complex Actionable Signals’ is a name I used when speaking of actionable signals that require a combination of 2 or more candlesticks.
Actionable Signals.
• All inside candlesticks(Absolute Truth #1)
• Hammers
• Shooting Stars
Complex Actionable Signals.
• (Absolute Truth Combo 1-3-1 )Inside Outside Inside
• Outside -> Hammer
• Outside -> Shooting Star
• Inside -> Hammer
• Inside -> Shooting Star
• Momentum Inside
• Momentum Hammer
• Momentum Shooting Star
• Hammer -> Shooting Star
• Shooting Star -> Hammer
5a. Example CAS 1-3G-1. I am including only one example of several of the CAS that are included in this script. The star is utilized for all CAS, the color and location designate the direction that the CAS would have you act on. Note the “Entry” and “Target” line were added manually and are not part of the script. This is one successful setup; don’t get excited thinking this is how it always works. I will let you discover and learn for yourself that there is many failed setups and many setups that never trigger the actionable signal. This is where setting alerts is very handy.
6. Alerts. Press on the “Create Alert” Icon for TradingView. When the prompt opens select the preferred script either “TheStrat Pro” or “TheStrat Noob” under “Condition” and then under the sub-menu select any of the following scenarios.
• C ▲/ ▼ = If the active CS shows a continuation up/down pattern, remember this CS is active and can still change direction and trigger a reversal in the other direction.
• R ▲/▼ = If the active CS shows a reversal up/down pattern, remember this CS is active and can still change direction and trigger a continuation in the previous trend direction.
• HM Trigger(Last High Cross) = Alert when the active CS breaks the high of the previous CS. As a new CS opens, it re-adjusts its values and is just constantly waiting for the active CS break through the previous CS high.
• SS Trigger(Last Low Cross) = Alert when the active CS breaks the low of the previous CS. As a new CS opens, it re-adjusts its values and is just constantly waiting for the active CS break through the previous CS low.
• Inside Trigger (Last High/Low Cross) = Alert when the active CS breaks the low or the high of the previous CS. As a new CS opens, it re-adjusts its values and is just constantly waiting for the active CS break through either the previous CS low or the high.
• Last CS Inside
• Last CS H
• Last CS S
• Last CS Actionable Signal (inside, H or S)
• Last CS Complex Actionable Signal
• Last CS Any Actionable Signal

MTFT Patterns Pro, TheStrat Suite (1of5)Multi Time Frame Tools
Multi Time Frame Tools (MTFT) is a suite of scripts aimed to establish a standard timeframe-based color scheme. This can be utilized to overlay different timeframes calculations/values over a single timeframe. As one example, this would allow to observe the 5-month moving average, 5-week moving average, and 5-day moving average overlaid over each other. This would allow to study a chart, get accustomed to the color scheme and study all these at the same time much easier.
All indicators calculated using the below specific timeframes as input, will always use the color scheme outlined below. This is to get you in habit of recognizing the different timeframes overlaid in top of each other. These can be personalized.
Longer TF analysis.
Yearly - Black
Semi-Annual - Yellow
Quarterly - White
Monthly - Maroon
Weekly - Royal Blue
Daily - Lime
Shorter TF analysis.
4 hour - Fuchsia
1 hour - Orange
30 min - Red
15 min - Brown
10 min - Purple
5 min - Lilac
All color coordination is able to be modified in either the “Inputs” or “Style” section. If you need to make changes, make sure to select “Save as Default” on the bottom right of the settings menu.
Recommended Chart Color Layout
I played around with color coordination a lot. The final product was what worked best for me. I personally use the following chart settings to accent all available TF colors.
-> Click on the settings wheel on your chart. -> Click on “Appearance”.
Background - Solid -> On the top row pick the 6th color from the left.
Vert Grid Lines and Horz Grid Lines -> On the top row pick the 7th color from the left.
You may of course change these and the indicator line colors as you like.
Adding indicator to Chart
-> Open the TradingView “Indicators & Strategies” library, the icon has “ƒx”. -> All premium scripts will be located under “Invite-Only Scripts” -> Click indicator to add to your chart.
MTFT TheStrat Suite (5 Scripts)
Rob Smith is the creator of ‘TheStrat’ trading strategy. For ‘TheStrat’ I have put together a suite of 5 premium scripts that combined will offer people interested in learning ‘TheStrat’ a cleaner learning process. For 2 of the 5 scripts specifically, the MTFT approach of overlaying multiple longer timeframes(TF) over a shorter TF selected as a display cannot be utilized. The other 2 scripts will have full MTFT functionality and they are my personal favorite. I will be providing very basic info to utilize this script; it is up to you to dive deep into learning this strategy. I am not an expert with the tool or a financial advisor. As with all aspects of life, I recommend you research, learn, discern and practice extensively in order to become a master.
*1. MTFT Patterns Pro/Noob
2. MTFT Full Time Frame Continuity Table
3. MTFT Last HML wOpen
4. MTFT Actionable Signal Targets
5. MTFT Reversal Lines
MTFT Patterns Pro/Noob, TheStrat Suite (1of5)
Features includes:
1.) Absolute Truth #. This setting will provide the candlesticks absolute truth # below the CS.
2.) Color bars based on Absolute Truth. This setting will color all inside candlesticks yellow, all Green Outside Candlesticks White and all Red Outside Candlesticks Fuchsia. Scenario 2 candlesticks are left as is and will color based on the color of the original candlestick. This setting is default enabled and needs to be disabled in the “Style” tab under the indicator settings wheel. I found this more practical in getting used to the 3 absolute truth scenarios.
3.) Reversals. This setting will mark when reversal patterns as discussed by Rob are posted. Noob version will also include the description of the reversal pattern, while the Pro version will only plot an ‘R’ without the text description. Note: There should never be back-to-back green Rs or red Rs. I found this issue a lot on many of the other ‘TheStrat’ scripts out there. TradingView development team note: The plotchar function does not allow dynamic text so this is the only reason on why there needs to be two separate versions of the script. ‘Pro’ is important for experienced users that already identify the patterns without the text and ‘Noob’ is important for beginner users that still need the text description of the pattern.
4. Continuations. This setting will mark when continuation patterns as discussed by Rob are posted. Noob version will also include the description of the continuation pattern, while the Pro version will only plot a ‘C’ without the text description.
TradingView Admin note: The plotchar function does not allow dynamic text so this is the only reason why there needs to be two separate versions of the script. ‘Pro’ is important for experienced users that already identify the patterns without the text and ‘Noob’ is important for beginner users that still need the text description of the pattern.
5. Actionable Signals and Complex Actionable Signals (CAS). This has several objective parameters as defined by Rob’s course. ‘Complex Actionable Signals’ is a name I used when speaking of actionable signals that require a combination of 2 or more candlesticks.
Actionable Signals.
• All inside candlesticks(Absolute Truth #1)
• Hammers
• Shooting Stars
Complex Actionable Signals.
• (Absolute Truth Combo 1-3-1 )Inside Outside Inside
• Outside -> Hammer
• Outside -> Shooting Star
• Inside -> Hammer
• Inside -> Shooting Star
• Momentum Inside
• Momentum Hammer
• Momentum Shooting Star
• Hammer -> Shooting Star
• Shooting Star -> Hammer
5a. Example CAS 1-3G-1. I am including only one example of several of the CAS that are included in this script. The star is utilized for all CAS, the color and location designate the direction that the CAS would have you act on. Note the “Entry” and “Target” line were added manually and are not part of the script. This is one successful setup; don’t get excited thinking this is how it always works. I will let you discover and learn for yourself that there is many failed setups and many setups that never trigger the actionable signal. This is where setting alerts is very handy.
6. Alerts. Press on the “Create Alert” Icon for TradingView. When the prompt opens select the preferred script either “TheStrat Pro” or “TheStrat Noob” under “Condition” and then under the sub-menu select any of the following scenarios.
• C ▲/ ▼ = If the active CS shows a continuation up/down pattern, remember this CS is active and can still change direction and trigger a reversal in the other direction.
• R ▲/▼ = If the active CS shows a reversal up/down pattern, remember this CS is active and can still change direction and trigger a continuation in the previous trend direction.
• HM Trigger(Last High Cross) = Alert when the active CS breaks the high of the previous CS. As a new CS opens, it re-adjusts its values and is just constantly waiting for the active CS break through the previous CS high.
• SS Trigger(Last Low Cross) = Alert when the active CS breaks the low of the previous CS. As a new CS opens, it re-adjusts its values and is just constantly waiting for the active CS break through the previous CS low.
• Inside Trigger (Last High/Low Cross) = Alert when the active CS breaks the low or the high of the previous CS. As a new CS opens, it re-adjusts its values and is just constantly waiting for the active CS break through either the previous CS low or the high.
• Last CS Inside
• Last CS H
• Last CS S
• Last CS Actionable Signal (inside, H or S)
• Last CS Complex Actionable Signal
• Last CS Any Actionable Signal
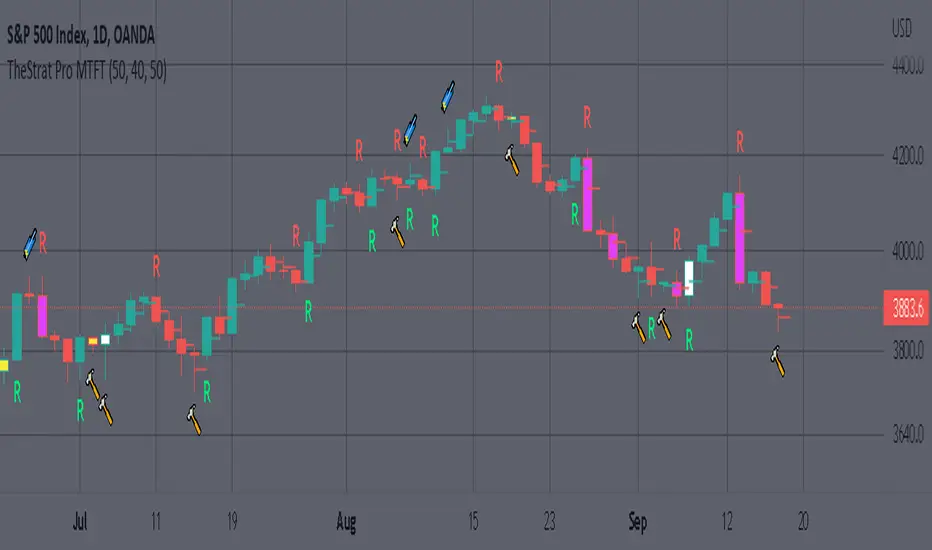
PriceCatch-SubPriceCatch Trading System consists of two scripts. PriceCatch-Main and PriceCatch-Sub.
This is a long trades (buy trades) only system. No short signals are included in this system.
PriceCatch-Sub is a helper script that works in conjunction with the main script and is plotted on a separate pane.
This script plots Heikin-Ashi Candles on the Chart. By observing the price action on the main script and comparing the same with the Heikin-Ashi Candles plotted on the bottom pane, buy trades are taken. This script helps traders to enter, manage and exit trades as it removes noise generally associated with Japanese candles and should be used along with main script.
When the main script signals that an upward price movement is probable, then the Heikin-Ashi candles are observed and buy trades are initiated only when both the scripts give confirmation signals.
While using this script and before initiating a buy trade, Traders must observe for red Heikin-Ashi candles with upper wick that gets rejected at the Macro Wave for an entry signal.
For exits from a trade, Traders must observe the highs of the Heikin-Ashi candles. Whenever the close of current Heikin-Ashi candle is lower than the earlier candle and current high is less than previous high, then prepare for price slow down or slipping down. When the Heikin-Ashi candles begin to close inside the Blue (Macro Wave) buy trades are not taken.
Traders must use PriceCatch-Main along with this helper script PriceCatch-Sub in their trading strategy as they work in tandem to help you identify entries, manage your trades and plan your exits. Remember, that the main script is the one that does the heavy lifting.
The PriceCatch Trading System attempts to hide complexity and presents actionable signals in a clean manner that makes it easy for traders of all levels to understand and benefit from.
This is a comprehensive system and support is provided to help you learn and to use it effectively.
Use the link below or PM us for trial access to this System.
Thank you.

Strength Analyzer [DW]This is an experimental hybrid between relative strength and spectrum analysis methods aimed to deliver useful insights about cyclical dominance and momentum.
This study utilizes a modified RSI formula and a modified Goertzel algorithm to determine relative strength and spectral dominance for periods 8 through 50.
These periods are theorized by many analysts to be the main cyclical components of market movement.
In this study, you are given the option to apply equalization (EQ) to the dataset before estimating strength.
This enables you to transform your data and observe how strength estimates changes as well.
Whether you want to give emphasis to some frequencies, isolate specific bands, or completely alter the shape of your waveform, EQ filtration makes for an interesting experience.
The default EQ preset in this script cuts low end presence, dampens high frequency oscillations, and cleanly passes main cyclic components.
There are many ways to use EQ to transform your dataset, so play around with the settings and find the presets that work best for your analysis setup.
After EQ processing, the data is then passed through the modified RSI algorithm to generate momentum information
The modified RSI in this script is rescaled to oscillate between -1 and 1, and has the option to pass through a 2 pole Butterworth low pass filter before and after processing for a smoother output.
The strength thresholds are determined by the threshold value, which quantifies distance above and below 0.
The threshold value can also be thought of as conventional RSI distance from 50 rescaled so that an increment of 0.1 is equivalent to an increment of 5 on a conventional RSI.
A threshold value of 0.4 is equivalent to thresholds of 70 and 30 on a conventional RSI, so this is the default. The maximum threshold value is 1, which is equivalent to thresholds of 100 and 0.
This script plots colored sections for each period value using a gradient color scheme based on their respective strength estimates.
The color scheme in this script is a multicolored gradient that shows green scaled colors for bullish strength and red scaled colors for bearish strength.
Darker, less vibrant colors indicate lower strength. Brighter, more vibrant colors indicate higher strength.
Strength values near 0 will show the darkest colors, and values near the positive or negative threshold value will show the brightest.
The data is fed parallel through the modified Goertzel algorithm to obtain cyclic power information and to estimate the dominant cycle.
Gerald Goertzel's algorithm is a unique Fourier related transform that identifies tonal properties by quantifying resonance in a set of second order IIR filters with direct-form structure.
It is computationally more efficient than typical DFT or FFT algorithms, and yields decent spectral resolution.
In this variation of the algorithm, data is first passed through a 2 pole high pass filter to attenuate spectral dilation, then passed through a Hamming Window to tidy up the frequency range.
The clean windowed data is then passed through a recursive resonance loop over the frequency block to calculate filter coefficients, which are then used to identify real and imaginary magnitude components.
From there, the magnitude components are used to calculate cyclic power.
The power outputs of each period are then compared for dominant cycle estimation, which is plotted over the gradient.
The dominant cycle can also be optionally smoothed or halved based on your preferences.
Bar colors are included in this script. The color scheme is a gradient based on dominant cycle momentum.
Signals and alert conditions are included in this script as well, and can be customized to your liking.
The two main signal types in this script are:
-> Dominant Cycle - Signals based on dominant cycle or half dominant cycle changes from positive to negative strength or vice versa.
-> Confluence - Signals based on confluence emergence. Based on the majority of measured cycles or all measured cycles showing positive or negative strength.
The signals in this are also externally accessible by other scripts.
The output format is 1 for long signals, and -1 for short signals.
To integrate these signals with your own system, use a source input in your script and assign it to this script's "Direction Signals" output variable from the dropdown tab.
In addition, I included two external output variables that show dominant cycle strength and average cycle strength.
They can be integrated into your own scripts by using a source input and selecting the proper output variable, just like the signals.
The Strength Analyzer is a versatile and powerful analytical tool to have in the arsenal for generating unique insights about momentum and cycle dominance.
By analyzing strength on a spectral basis, we can look at relative price movements on a deeper level and gain insights that aren't necessarily obvious from simply looking at a price chart.
------------------------------------------------
This is a premium script, and access is provided on an invite-only basis.
To gain access, get a copy of the script overview, or for any other inquiries, send me a direct message!
I look forward to hearing from you!
------------------------------------------------
General Disclaimer:
Trading stocks, futures, Forex, options, ETFs, cryptocurrencies or any other financial instrument has large potential rewards, but also large potential risk.
You must be aware of the risks and be willing to accept them in order to invest in stocks, futures, Forex, options, ETFs or cryptocurrencies.
Don’t trade with money you can’t afford to lose.
This is neither a solicitation nor an offer to Buy/Sell stocks, futures, Forex, options, ETFs, cryptocurrencies or any other financial instrument.
No representation is being made that any account will or is likely to achieve profits or losses of any kind.
The past performance of any trading system or methodology is not necessarily indicative of future results.
------------------------------------------------
Note:
Because TV's UI can't handle displaying style options for 43 fills with 42 colors, the color scheme of the analyzer is currently not editable.
However, no other sacrifices to functionality or quality were made in this project.
As the TV team performs updates on the platform, the ability to customize this color scheme will likely come as well.
Also, it's important to note that this script uses a heavy amount of calculations to generate this output.
At times (very infrequently), TV will throw an error message saying "Calculation Takes Too Long", likely due to a momentary lull in available server space.
If you receive this error, simply hide then unhide the indicator, and everything should function as expected.
Script Stopwatch - PineCoders FAQ█ WARNING
The publication of our LibraryStopwatch has deprecated this publication.
█ ORIGINAL DESCRIPTION
This script calculates the run time of a Pine script. While its numbers are not very precise and it doesn’t work on all scripts, it will help developers calculate run times more precisely than by hand, and so provides Pine coders with an additional profiling tool to help them optimize their code.
How to use the code
• Place the code included between the up/down arrows after your script’s input() calls.
• Comment out the display modes you don’t want to use.
• Save your script, wait and look at the results.
• Results show in different colors, depending on the average time per bar:
- green for < 5 ms
- dark red for < 50 ms
- bright red for > 50 ms (the maximum allowed is 200).
How the code works
The code in this script starts by saving the value of the timenow variable on the first bar. While the time variable returns the time at the beginning of the bar, timenow returns the current time. The code then follows the progression of timenow during the script’s execution. The variable only updates every second, so in between updates the script makes an estimate of the total time elapsed by adding the last average time per bar calculated to each bar that passes until timenow increases by another 1000 because one more second has elapsed since its last update. At that point a new, current average time per bar is calculated and the cycle repeats.
The code only calculates elapsed time for the initial run. Once the realtime bar is hit, timing stops so that time spent in the realtime bar does not affect the numbers once they have been calculated on the script’s initial pass over the dataset.
Notes
• If results show zero elapsed time, it’s most probably because your script executes in less than one second, which is very good. In that case timenow hasn’t changed, so no timing can be calculated.
• The code is quirky and doesn’t work on all scripts.
• It doesn’t properly time execution of security() calls.
• The average time per bar will sometimes vary quite a bit with changes in chart resolution.
Look first. Then leap.